The transition toward sustainable manufacturing represents a pivotal change in how businesses approach production, blending environmental care with economic viability and social good. This evolution is motivated by an understanding that sustainable practices limit environmental harm, promote economic prosperity, spur innovation, and offer a competitive edge. Leading corporations, including BMW, Procter & Gamble, and Nestlé, have demonstrated the practicality and profitability of incorporating sustainability into their operations.
Incorporating sustainability into manufacturing requires a careful balance between initial costs and long-term benefits, focusing on increasing efficiency, fostering innovation, and engaging with stakeholders. These strategies are key to improving financial performance and maintaining a competitive position in the market.
The shift towards sustainable manufacturing is motivated by numerous factors, highlighting its advantages for the corporate world and the environment. Optimizing the consumption of raw materials, energy, and water slashes production expenses significantly. Practices aimed at environmental stewardship typically result in reduced waste and heightened efficiency in energy use, positively impacting a company’s profit margins. Embracing these sustainable practices allows manufacturers to alleviate the risks of fluctuating raw materials and energy costs. For instance, incorporating recycled materials can stabilize expenses and reduce vulnerability to market changes.
Firms dedicated to environmental stewardship are poised to attract investments from funds and investors that value sustainability, which is crucial for funding innovations, business expansion, and product and process quality enhancements. Additionally, financial incentives like tax reductions or grants provided by governments and international entities further support the economic feasibility of integrating new sustainable technologies or methodologies.
Sustainability also paves the way to unlocking new markets and customer segments, responding to surging demand for eco-friendly products. This demand can enable companies to command higher prices, foster greater customer loyalty, and penetrate markets where environmental stewardship is either a regulatory mandate or a consumer expectation.
The movement towards sustainable manufacturing has inspired numerous companies across various sectors to innovate and implement practices that reduce environmental impacts while bolstering economic performance. Some examples include:
BMW Group – Sustainable Automotive Manufacturing The BMW Group has incorporated sustainability into every aspect of its production process. From using renewable energy sources to power its manufacturing plants to implementing recycling and water conservation practices, BMW has set a high standard for sustainability in the automotive industry. For example, the company’s Leipzig plant powered by wind energy utilizes lightweight materials to improve vehicle fuel economy, demonstrating BMW’s comprehensive approach to sustainable manufacturing.
Procter & Gamble (P&G) – Eco-Friendly Consumer Products Procter & Gamble (P&G), a major player in the global consumer goods industry, has fully integrated sustainability into its business approach. Through its Ambition 2030 initiative, P&G endeavors to catalyze positive environmental and societal change while generating value for the company and its consumers. This commitment entails reducing greenhouse gas emissions, transitioning to 100% renewable electricity procurement, and eliminating manufacturing waste sent to landfills across its worldwide network of production facilities.
Nestlé – Reducing Environmental Footprint Nestlé, the world’s largest food and beverage company, has committed to making 100% of its packaging recyclable or reusable by 2025 and to reduce its net greenhouse gas emissions to zero by 2050. The company focuses on improving the environmental performance of its products through design, sourcing sustainable materials, and innovating in waste management practices. Nestlé’s efforts also extend to water efficiency and stewardship, recognizing the critical importance of water conservation in its operations.
Companies offering sustainability solutions to manufacturers are leveraging innovative technologies and strategic approaches to address environmental stewardship challenges, enhance operational productivity, and drive market competitiveness. For example:
Honeywell demonstrates its commitment to sustainability through a wide range of solutions that target various aspects of manufacturing operations, from energy reduction to circular economy practices. The company’s solutions span circular economy initiatives, environmental transformation, energy evolution, and resiliency and accountability, highlighting their broad approach to addressing the manufacturing sector’s sustainability challenges.
The Efficiency Network (TEN) focuses on next-generation building energy efficiency by developing, designing, engineering, financing, and installing cost-effective, energy-saving retrofit projects. Their unique approach combines process automation with industry expertise to revolutionize how energy performance projects and customer relationships are managed. By prioritizing sustainability, TEN aims to reduce energy and operating expenses, lower maintenance costs, and enhance its reputation and employee morale.
Hitachi has positioned itself at the forefront of fostering eco-friendly manufacturing by developing and deploying innovative digital solutions. These innovations empower producers to streamline their operations, diminish energy use, and reduce their environmental impact, leading to greener manufacturing practices. A prime example is the Lumada Manufacturing Insights platform, which has been instrumental for businesses like Logan Aluminum. This tool facilitates the creation of operations based on data analytics, improving supply chain transparency, employing predictive analytics, and advancing intelligent factory capabilities. The result is an uplift in operational performance, minimized equipment downtime, and a significant step towards achieving environmental sustainability by making the manufacturing process more resource-effective and less demanding of natural resources.
Environmental consultants are pivotal in helping manufacturing companies navigate the complexities of sustainability. By offering strategic guidance, performance improvement insights, and communication and reporting strategies, these consultants enable businesses to effectively align their operations with sustainable practices.
The most effective planning frequently comes from environmental consultants who excel in developing sustainable solutions, with a particular focus on alternative sustainability elements. They offer expert advice and have the engineers and scientists to turn solutions into tangible results. These consultants play a crucial role in bridging sustainability gaps between plans and achievements, ensuring that strategies are environmentally friendly but also practical and implementable. They can provide third-party verification of sustainability efforts and credits related to waste reduction and resource management. Highly experienced environmental firms are in high demand for their ability to manage heavy manufacturing processes that produce wastewater, delivering effective treatment or disposal solutions for liquid wastes.
SCS Engineers, for instance, offers comprehensive services that assist companies in understanding their environmental impacts, identifying areas for improvement, and embedding environmental stewardship into their business strategies. These tailored services reduce risks, optimize environmental footprints, and enhance innovation for a competitive edge.
Consultants advocate practical sustainability measures, including optimizing biofuel use, decreasing pollution, engaging in time-saving practices, energy efficiencies, recycling, and reducing waste production. For example, switching to renewable energy sources, conducting energy audits, and investing in energy-efficient technology can significantly lower carbon footprints and operational costs.
Likewise, implementing pollution prevention practices, using eco-friendly materials, and engaging in recycling and closed-loop manufacturing are vital steps toward minimizing environmental impact and fostering sustainable growth.
Environmental consultants offer the expertise and tools necessary for manufacturing companies to achieve their environmental stewardship goals, highlighting a clear path towards more responsible and efficient manufacturing practices.
For companies to progress in their sustainability journey, they integrate sustainability comprehensively and systematically across all business operations, moving beyond isolated efforts. While enhancing efficiency and minimizing risks are crucial, pursuing sustainability offers competitive advantages, innovation opportunities, and revenue growth potential.
By employing innovation and strategic foresight, businesses can surpass basic compliance and proactively address upcoming challenges and opportunities, adopting a forward-looking approach that contemplates their operations’ long-term environmental and societal implications.
The drive towards sustainable manufacturing is essential in corporate production approaches, marrying environmental stewardship with economic and social advantages. This transition, led by companies like BMW, Procter & Gamble, and Nestlé, proves sustainable manufacturing is viable and profitable.
Embracing sustainability is not merely about meeting environmental standards but capturing opportunities for growth, innovation, and leadership in the global market. The successful implementation of sustainability strategies demonstrates that businesses can thrive while contributing positively to the planet’s future. The collective efforts of these leading companies offer a promising path toward a more sustainable, efficient, and inclusive industrial world.

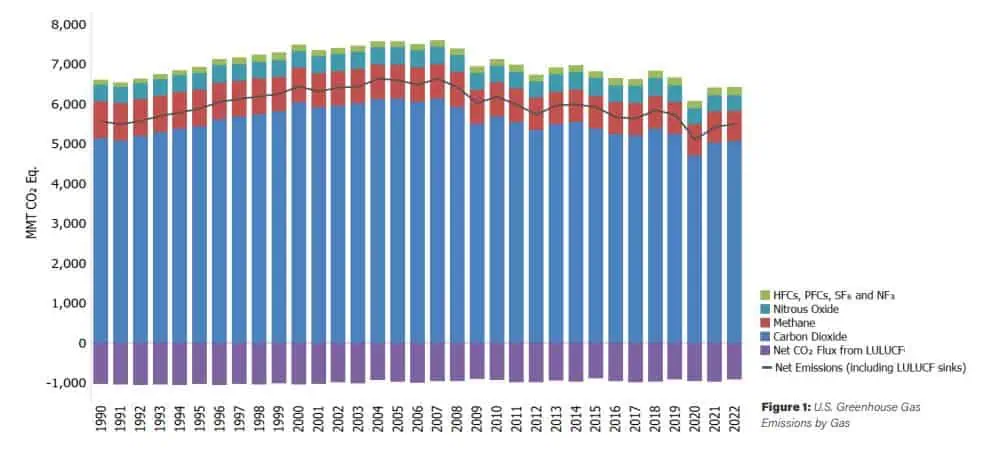
On April 11, 2024, the U.S. Environmental Protection Agency (EPA) released its annual Inventory of U.S. Greenhouse Gas Emissions and Sinks (GHG Inventory), presenting a national-level overview of annual greenhouse gas emissions from 1990 to 2022.
The GHG inventory identifies and quantifies anthropogenic sources and sinks of greenhouse gas emissions and removals, which is essential for quantifying and qualifying data used to address climate change and measure the impact of environmental solutions and sustainability plans. In this context, the term “anthropogenic” refers to greenhouse gas emissions and removals that are a direct result of human activities or are the result of natural processes that have been affected by human activities.
The GHG Inventory covers seven key greenhouse gases: carbon dioxide, methane, nitrous oxide, hydrofluorocarbons, perfluorocarbons, sulfur hexafluoride, and nitrogen trifluoride. In addition to tracking U.S. greenhouse gas emissions, the Inventory calculates carbon dioxide removed from the atmosphere through carbon uptake in forests and other vegetation.
Greenhouse gases are emitted and reported across five economic sectors: transportation, electric power (electricity generation), residential/commercial (homes and businesses), industry, and agriculture. Emissions from commercial/residential and industrial activities account for a much larger share of U.S. greenhouse gas due to their proportionately larger share of electricity use in these sectors (e.g., heating, ventilation, and air conditioning; lighting; appliances; powering industrial machinery).
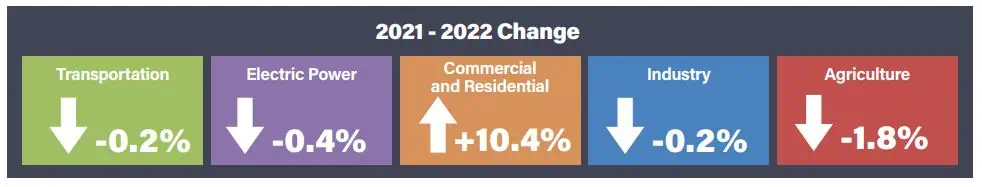
Transportation activities were the largest source (28 percent) of total U.S. greenhouse gas emissions in 2022. From 1990 to 2022, transportation CO2 emissions from fossil fuel combustion increased by 19 percent, largely due to increased travel demand.
The electric power sector accounted for 25 percent of U.S. greenhouse gas emissions in 2022. Emissions from this sector have decreased by approximately 16 percent since 1990, and the carbon intensity of the sector, in terms of emissions (CO2 Eq.) per QBtu input, has decreased by 28 percent. Total electric power generation increased by 3 percent in 2022, while electric power-related emissions decreased by less than 1 percent due in part to a decrease in coal consumed to produce electricity and an increase in renewable generation.
The commercial and residential sectors accounted for 7 and 6 percent, respectively, of total U.S. greenhouse gas emissions in 2022, excluding indirect emissions from electricity end-use. Emissions from these sectors are primarily from building-related activities such as heating and cooking and have increased since 1990. Emissions from commercial and residential buildings also increase substantially when emissions from electricity end-use are included because the building sector uses 75 percent of the electricity generated in the U.S. for heating, ventilation, air conditioning, lighting, and appliances (NREL 2023). Total residential and commercial greenhouse gas emissions, including direct and indirect emissions, have decreased by 1 percent since 1990.
The industrial sector accounted for 23 percent of U.S. greenhouse gas emissions in 2022, excluding indirect emissions from electricity end-use. If indirect emissions from electricity use are distributed to the industrial end-use sector (e.g., powering equipment and industrial buildings), industrial activities account for 30 percent of U.S. greenhouse gas emissions. Since 1990, emissions from industry have declined by 16 percent. Shifts in industrial output away from energy-intensive manufacturing products to less energy-intensive products have had a significant positive impact on industrial emissions.
Agriculture accounted for about 10 percent of U.S. greenhouse gas emissions in 2022 and includes sources such as livestock enteric fermentation and manure management, N2O emitted from managed agricultural soils from fertilizers and other management practices, and fossil fuel combustion from agricultural equipment. Indirect emissions from electricity in the agricultural sector are about 5 percent of sector emissions. In 2022, agricultural soil management was the largest source of N2O emissions, and enteric fermentation was the largest source of CH4 emissions in the U.S. There are several strategies for reducing CH4 emissions from enteric fermentation and manure management, including anaerobic digestion and liquid-solid separation, which the sector is embracing.
A summary of greenhouse gas emissions from the Waste sub-sector is below. In 2022, waste activities generated emissions of 166.9 MMT CO2 Eq., or 2.6 percent of total U.S. greenhouse gas emissions.
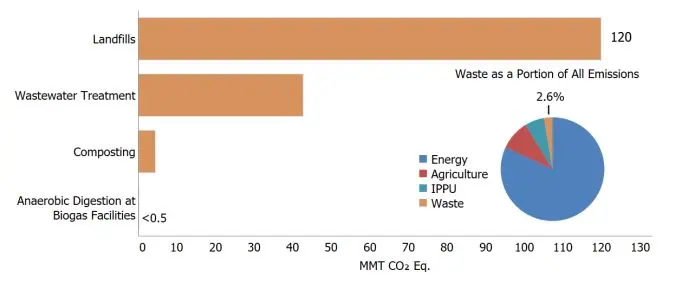
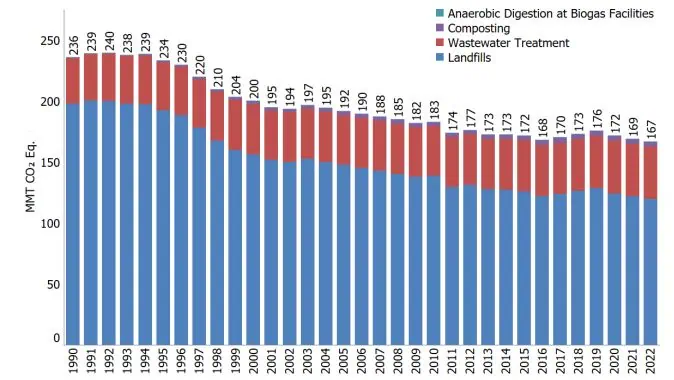
Methane generation and emissions from landfills are a function of several factors. Each landfill has unique characteristics, but emissions from MSW landfills accounted for approximately 84 percent of total landfill emissions (100.9 MMT CO2 Eq.), while industrial waste landfills accounted for the remainder (18.9 MMT CO2 Eq.). Nationally, there are significantly fewer industrial waste landfills than MSW landfills, contributing to the lower national estimate of CH4 emissions for industrial waste landfills.
The annual amount of MSW generated and disposed of in MSW landfills varies annually and depends on several factors (e.g., the economy, consumer patterns, recycling, composting programs, and inclusion in a garbage collection service).
The estimated annual quantity of waste placed in MSW landfills increased by 10 percent from approximately 205 MMT in 1990 to 226 MMT in 2000, then decreased by 11 percent to 202 MMT in 2010, and then increased by 7 percent to approximately 217 MMT in 2022.
Emissions decreased between 1990 and 2022 largely because of increased use of landfill gas collection and control systems, closure of older landfills, better management practices, and increased organics diversion through state and local policy and regulations.
Biogas, Anaerobic Digestion, Renewable Natural Gas and Energy Systems
Carbon Sequestration & Deep Well Injection
CCR and Electric Utilities
Clean Air Act
Facility Energy Management
Greenhouse Gas Monitoring, Control, Inventory
Landfill Gas and LFGE
Liquids Management – Wastewater and Leachate
Material Recovery Facilities and Transfer Stations
Oil and Gas Exploration and Production
Organics Management, Composting
SCS Remote Monitoring and Control® (Emissions Tracking)
SCSeTools® (LFG Tracking)
Solid Waste Planning, Sustainable Materials Management
Sustainable Solutions Planning
Partial reprint of EPA’s Announcement dated January 11, 2024
WASHINGTON – The U.S. Environmental Protection Agency on Thursday announced a proposal to strengthen Clean Air Act standards for large facilities that burn municipal solid waste. If finalized, the updated standards would reduce emissions of nine pollutants, including smog- and soot-forming sulfur dioxide and nitrogen oxides, by approximately 14,000 tons per year, improving air quality for overburdened communities living near these facilities. These proposed standards reflect current technologies available to control pollution in a cost-effective fashion.
The proposed standards would apply to 57 facilities with 152 units that have the capacity to combust more than 250 tons per day of municipal solid waste. Nearly 4 million Americans live within 3 miles of these large facilities, which are disproportionately located in low-income communities and communities of color.
The proposed standards are based on emission levels achieved by the best controlled and lower-emitting sources, and limit emissions of nine pollutants: particulate matter, sulfur dioxide, hydrogen chloride, nitrogen oxides, carbon monoxide, lead, cadmium, mercury, and dioxins/furans.
The Clean Air Act requires EPA to evaluate these standards every five years in order to take into account developments in pollution control technologies and techniques. EPA last revised these standards in 2006.
After accounting for compliance costs of the rule, EPA estimated the net present value of health benefits from the proposed rule, due to reductions in particulate matter and ozone alone, to be up to $14 billion over 20 years. Reductions of mercury, lead, and other hazardous air pollutants required by the proposal are expected to result in additional unquantified economic and public health benefits.
EPA will accept comment on the proposal for 60 days after publication in the Federal Register. EPA will hold an informational webinar and will announce details on its website shortly.
Additional Resources:
A Brief Regulatory History in California
On June 22, 2023, the California Air Resources Board (CARB) approved amendments to the Greenhouse Gas Emission Standards for Crude Oil and Natural Gas Facilities (Oil and Gas Methane Regulation). On November 2, 2023, CARB proposed additional modifications for public review. The public comment period ends November 17, 2023.
The Oil and Gas Methane Regulation was originally adopted in 2017 to reduce emissions by requiring:
Then in 2018, this regulation was included in California’s State Implementation Plan (SIP) to address VOC control requirements from the US EPA’s 2016 Control Techniques Guidelines (CTG) for the Oil and Natural Gas Industry. In 2022, the US EPA reviewed the SIP submittal and developed a list of deficiencies. Therefore, the Oil and Gas Methane Regulation was amended to address deficiencies and avoid sanctions under the Clean Air Act.
The Oil and Gas Methane Regulation was also amended so that CARB can use remote monitoring data from approved technologies to detect methane emission plumes and then mandate correction actions.
For example, it is anticipated that CARB will start receiving satellite data in late 2023. Once notified by CARB of a remotely detected methane plume, a facility will need to conduct inspections and repairs as well as submit reports as required by the amended regulation.
Finally, additional amendments were made to clarify the regulatory language based upon CARB’s experience with implementing the regulation over the past five years. Based on this summary in California, there is more movement in other states and not just for oil & gas facilities, but many more.
What to Expect in 2024 – Nationwide
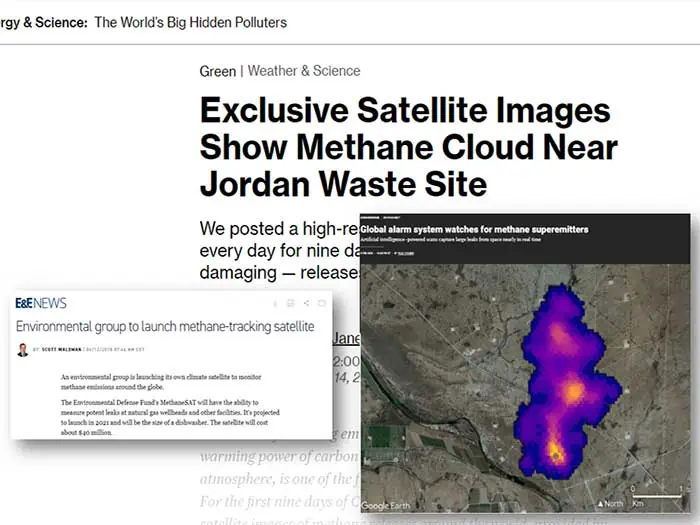
The use of satellites and Carbon Mapper are game changers. Carbon Mapper is a nonprofit entity that started flying key mission sectors and not just landfills or waste management sites. They target energy production facilities, agriculture, particularly livestock coal, mining operations, and oil and gas facilities.
The purpose is to track strong methane emissions, obviously. But the kicker is that the data is free and open to the public in the form of a methane plume overlaid on a map. The imagery usually has estimated emissions rates. Many facility owners, managers, and businesses are not aware of these monitoring events, let alone the accessibility and transparency via the Internet to the public.
Our clients reach out to us knowing that SCS has a robust drone and monitoring program – we can fly the sites and locate leak sources in hours. By using drones, our clients could respond quickly and we could identify current limitations of satellite technology for them. The resolution at a satellites high altitude does not detect and localize leak sources, but remote monitoring and control does.
Many of our clients take a proactive approach now of reoccurring drone methane inspections. We can identify areas of concern before the site is flown by manned aircraft or capture by satellites, and mitigate any potential issues ahead of making headline news. The benefit for implementing long-term operational enhancements and efficiencies prevents odors, complaints, nuisance suits, and negative headlines.
There are complementary technologies that work together, satellites, planes, drones, robot-dogs, automated wellheads, and the traditional boots on the ground. The key is combining the ones that work together to provide a more holistic view of of what’s going on at your facility. That’s where the ROI is and provides a single source to combine all data elements – so no need to move back and forth between software systems.
Questions? Contact our professionals at for immediate assistance.
Additional GHG Emissions Resources
The other night, I woke up in a bit of a panic and thought that I must have missed an announcement by the USEPA regarding the PM2.5 NAAQS reconsideration! Did I?
The answer, thankfully, is no! However, that is not any reason to relax and take no action.
By way of background, the Clean Air Act requires that the USEPA set National Ambient Air Quality Standards (NAAQS) for each of the criteria air pollutants, including particulate matter (PM). These NAAQS are based on the best available science and aim to protect human health and welfare. In June of 2021, the USEPA announced that they would reconsider the 2020 PM NAAQS final action under the prior administration that did not lower any standards. Then, in January 2023, the USEPA published the proposed rule to revise the PM2.5 primary annual standard down from 12 micrograms per cubic meter (µg/m3) to within a range of 9-10 µg/m3. In that proposal, the agency retained the 24-hour standard of 35 µg/m3.
The comment period for this proposed rule has since closed, and the agency is now working through over 5,000 submitted comments. It is unclear when the USEPA will issue the final rule (it could be any day now) and if the new annual standard will be set at 9 or 10 or something in between.
What does this mean for me as a regulated source? What should you do? SCS Engineers recommends the following actions:
Additional Resources:
About the Author: Rafe Christopherson, PE, is a project director and SCS’s industrial Clean Air Act leader. He is an air quality professional with a wide variety of experience over his 25-year career. His expertise includes consulting, working at an air quality regulatory agency and with industry. His expertise includes semiconductors, biofuels, pulp and paper, hardwoods, power generation, refineries, and general manufacturing. If you are interested in more information on this PM2.5 NAAQS reconsideration process and what it might mean for your business, you may reach Rafe at or via LinkedIn.
The proposed AERR rule would require nearly 130,000 facilities to report air toxics emissions directly to EPA. It would also give states the option to collect the air toxics data from industry (rather than states) and report it to EPA, provided the Agency approves their program. This proposed action would allow for EPA to annually collect (starting in 2027) hazardous air pollutant (HAP) emissions data for point sources in addition to continuing the criteria air pollutant and precursor (CAP) collection in place under the existing AERR.
Here are some key things to know about the proposed rule from the EPA website:
1. It would require air toxics (hazardous air pollutant) emissions reporting. While most states voluntarily report air toxics emissions data to EPA now, reporting is not consistent nationwide. The proposal would require many industrial facilities to report air toxics emissions data and offers states the option to report emissions on behalf of the industry sources in their states.
2. It would mean that more facilities must report emissions every year by using the same emissions thresholds every year to determine whether a facility’s detailed emissions information must be reported.
3. It would fill reporting gaps for some portions of Indian country and federal waters. The AERR proposal would require industry to report emissions for certain facilities that operate in those areas and that currently are not reported.
4. It includes provisions to limit the burden on small businesses. The proposal includes flexibilities such as allowing certain small businesses to report a facility’s total air toxics emissions instead of detailed data and exempting many collision repair shops from air toxics reporting requirements.
5. It would provide EPA information that would help the Agency improve its estimates of emissions from prescribed fires. EPA is committed to helping communities and our federal, state, local, and tribal partners manage the health impacts of smoke from wildland fires, including prescribed fires. Prescribed fire is a land management tool that can reduce the likelihood of catastrophic wildfires by reducing the buildup of unwanted fuels.
Additional Resources:

On June 12, 2023, the Maryland Department of the Environment (MDE) published its final regulation addressing the control of landfill gas (LFG) methane emissions from municipal solid waste (MSW) landfills in the state (promulgated under COMAR 26.11.42). Methane is a potent greenhouse gas (GHG) with a global warming potential more than 25 times greater than carbon dioxide. The rule has been several years in the making and is modeled after similar rules in California and Oregon. The rule also incorporates provisions from the EPA’s federal landfill air regulations under NSPS & EG 40 CFR 60 Subparts Cf and XXX and NESHAP CFR 63 Subpart AAAA and stands among the most stringent in the US.
The new regulation will be submitted to the EPA for approval as part of Maryland’s state plan for MSW landfills (state plan). The state plan will be equivalent to or more stringent than the EPA’s NSPS & EG 40 CFR 60 Subparts Cf and XXX and NESHAP CFR 63 Subpart AAAA and will apply to smaller and mid-sized landfills not currently subject to the EPA’s federal rules. MDE estimates that 32 active and closed MSW landfills in the state will be subject to the rule. The rule is effective June 12, 2023.
Some key provisions of the rule include:
This rulemaking has been several years in development and is consistent with Maryland’s GHG Reduction Act of 2009 and the recent Climate Solutions Now Act of 2022 that requires Maryland to become “net zero” for GHG emissions by 2045, with an interim goal of achieving 60% GHG reductions by 2031 (over 2006 levels). MDE estimates this rule will achieve a 25-50% reduction in GHG emissions from affected landfills.
Additional information on MSW regulations and GHG emission reductions:

Dr. Ketan Shah’s paper entitled “Single-use plastic bottle emissions using life cycle assessment for the US States, challenges, impact, and recommendations” is publishing in June, but those attending the Air and Waste Management Association conference in Orlando, Florida, have the chance to hear Dr. Shah discuss his methods used to develop methane emission estimates and recommendations to reduce them.
Plastics in solid waste management (SWM) are an exigent and pressing problem for many cities. Globally landfills/open dumpsites are used to dispose of over 80% solid wastes, currently serving around 3.5-4 billion people. This number is expected to grow with increased urbanization and population growth (ISWA, 2015).
Methane generation, recovery, and emissions projections for single-use plastic bottles play a vital role in the recycling industry. The scope of work described in this research project includes providing the basis for the methane estimates that discuss the data, assumptions, and calculation methods used to develop the estimates.
Methane emissions estimates to help assess the potential of single-use plastic bottles will have on greenhouse gas (GHG) emissions. As some U.S. states move towards requiring extended producer responsibility (EPR) for the packaging industry to address its waste management impacts, the analysis for the project commends firms for taking steps to pro-actively find a waste management solution for single-use plastic bottles, which may be the next target for EPR legislation.
Objective 1 – Develop Estimates of emissions from single-use plastic bottles using OpenLCA software based on Life Cycle assessment analysis.
Objective 2 – Prepare Comparative analysis for alternative recyclability scenarios.
Objective 3 – Recommendations and solutions to the single use plastic bottles challenge.
The case study results are based on the assumptions for the emissions from the single-use plastic bottles supply chain from cradle to grave. Finally, recommendations for these impacts and challenges will be discussed in detail. Diverting single-use plastic bottles going to landfills helps in reducing the overall environmental impact.
A&WMA ACE 2023 (awma.org). The Air & Waste Management Association (A&WMA) brings leading environmental scientists, practitioners, regulators, and leading environmental firms such as SCS Engineers together to share the latest initiatives addressing environmental issues facing communities such as climate change, exposure reduction through innovative technology and regulatory approaches, sustainability, community monitoring, and environmental justice.
Additional Resources:
Odor attribution is a complicated process when nuisance odors are intermittent and come from more than one source. Today’s blog discusses technological advances in olfactometers and processes to investigate and resolve industrial or agricultural odors.
To investigate odors, SCS begins by reviewing odor complaints for patterns based on location, time of day, the month of the year, and local wind conditions. We then use a site survey to identify candidate sources of odor that may contribute to the region’s odor complaints. Next, we assess the relative contributions of the most probable sources identified by collecting odor samples at/near each source and upwind, downwind, and crosswind. Traditionally, a limited number of odor samples could be collected daily in Tedlar® bags and shipped overnight to a certified laboratory for analysis by an odor panel. The odor panel uses an olfactometer to sniff air samples at varying dilutions for odor concentration, character, and intensity following American Society for Testing and Materials (ASTM) methods.
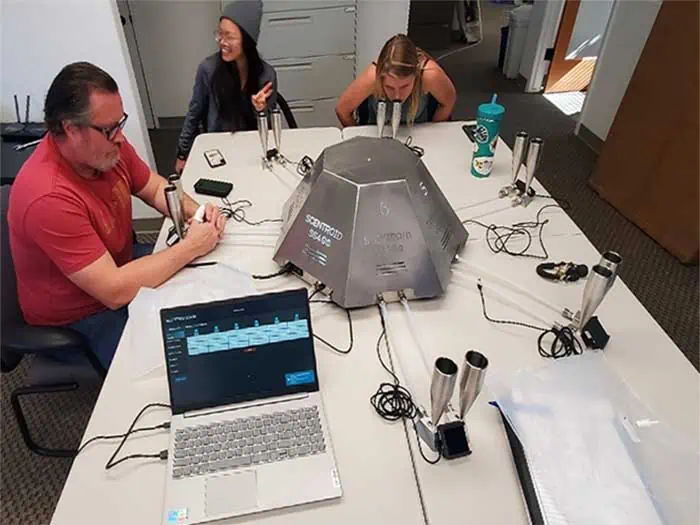
In certain situations, however, using a portable olfactometer in the field is more efficient. SCS recently implemented the Scentroid SS400 Six Station Portable Olfactometer Odor Lab for large odor studies. The Scentroid SS400 is the world’s only portable six (6) panel olfactometer compliant with European Standard EN 13725/2003 and ASTM E679-04 and is compact for easy transportation and deployment in remote locations. The Scentroid SS400 allows us to:
By having more data, our SCS professionals gain insight into complex nuisance odors and propose targeted mitigation measures that reduce odor concentrations downwind. With over 30 years of experience resolving odors from landfills, wastewater treatment plants, composting facilities, agricultural and manufacturing facilities, we’re confident we can help your facility come up smelling like roses too.
 Meet the Author: Greg Hauser is an SCS Project Director responsible for environmental compliance projects. He has over 30 years of experience with compliance topics such as air quality permitting, emission inventories, dispersion modeling, health risk assessments, and odor impact assessments. Mr. Hauser is experienced conducting odor studies of composting, landfill, and wastewater treatment plant operations. He has surveyed facilities to identify sources of interest, collected field samples of odorous emissions, developed odor emission profiles based on odor concentrations and odor flow rates, and conducted dispersion modeling to predict odor concentrations at or beyond the facility’s property boundary. He also provides health risk assessments for aerospace, manufacturing, wastewater treatment, and oil and gas facilities.
Additional Resources:
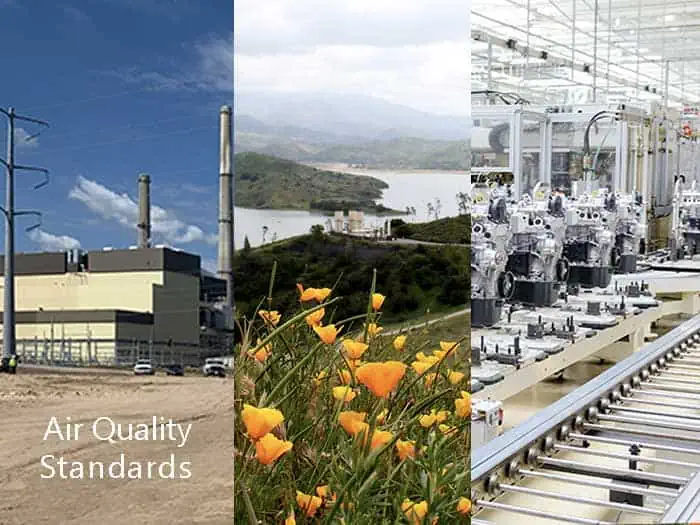
Air permitting compliance is a crucial aspect of operating a facility that generates air emissions. The process involves obtaining permits from regulatory agencies that establish requirements to demonstrate that the facility operates within limits set by air quality regulations.
Air permitting is not just for industrial operations but impacts many businesses.
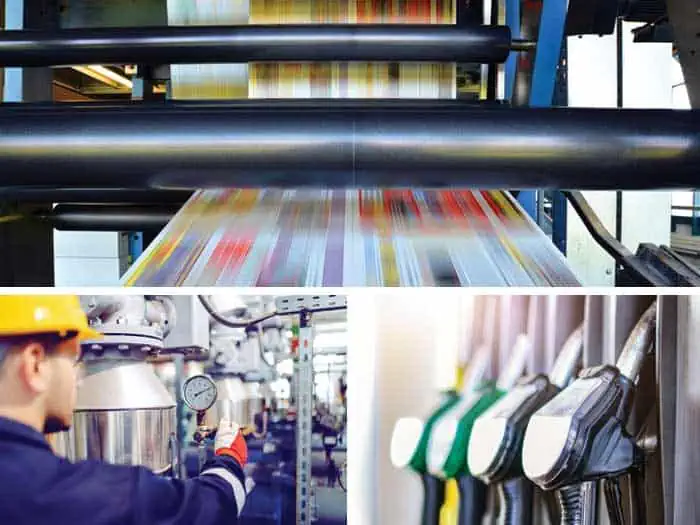
In Miami-Dade County, Florida, the agency responsible for issuing air permits is the Department of Environmental Resources Management (DERM). Businesses that emit air pollutants, such as fine particulate matter (dust), volatile organic compounds, and hazardous air pollutants, or which operate combustion equipment such as ovens, furnaces, boilers, and backup power generators must obtain air permits to operate legally. The Florida Department of Environmental Quality provides state guidance here. These permits are required to ensure that the facility’s emissions are within limits set by air quality regulations and that the facility is taking the necessary steps to control and reduce emissions.
Local business example
In the case of one apparel printing facility in Miami-Dade County, SCS Engineers (SCS) was hired to assist with obtaining the necessary air permits from DERM. The scope of services included reviewing current and proposed operations information, calculating air emission estimates, and preparing the narrative and application forms. SCS also prepared a Request for Information (RFI) to confirm the necessary background information, such as equipment specifications, facility layout, projected usage, and operating records. The deliverables included an Air Construction Permit Application and an Air Operating Permit Application. In this case, SCS could prove that the client did not need a permit even though the regulatory agency thought they might.
What are the steps?
The process of obtaining an air permit can be complex and time-consuming, which is why businesses often hire specialized environmental engineering firms to assist them. In this example, SCS provided DERM with a detailed report and application package, including a process flow diagram, equipment specifications, and actual and potential emissions calculations.
It’s important for businesses operating in Miami-Dade, or any county, to understand the air permitting process and the regulations set by local authorities. Environmental engineering firms can provide more accurate and detailed information, so management understands the specific air quality regulations that apply to their business.
The value is in implementing the practices necessary to maintain compliance with air quality regulations and keeps your reputation with workers and the community stellar. Businesses continuing to operate illegally face administrative and civil violations, court actions, and potential environmental insurance challenges. Another consideration is that the same engineering firm can likely advise you on stormwater and groundwater permits and compliance for your facility.
About the Author: Troy Schick, PE, is a Project Manager based in our Miami, Florida, office. He is a Professional Engineer licensed in Florida and a Qualified Stormwater Management Inspector.
Stormwater and Air Permitting Compliance Resources for Businesses: