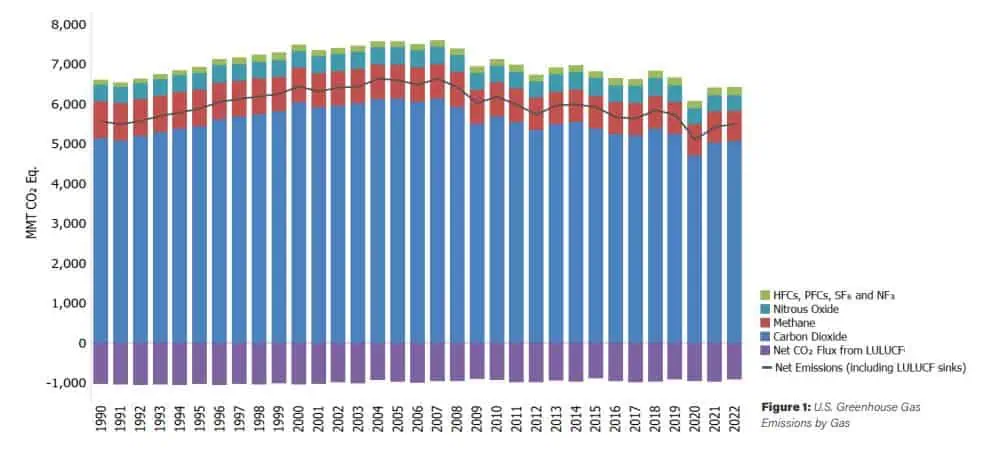
On April 11, 2024, the U.S. Environmental Protection Agency (EPA) released its annual Inventory of U.S. Greenhouse Gas Emissions and Sinks (GHG Inventory), presenting a national-level overview of annual greenhouse gas emissions from 1990 to 2022.
The GHG inventory identifies and quantifies anthropogenic sources and sinks of greenhouse gas emissions and removals, which is essential for quantifying and qualifying data used to address climate change and measure the impact of environmental solutions and sustainability plans. In this context, the term “anthropogenic” refers to greenhouse gas emissions and removals that are a direct result of human activities or are the result of natural processes that have been affected by human activities.
The GHG Inventory covers seven key greenhouse gases: carbon dioxide, methane, nitrous oxide, hydrofluorocarbons, perfluorocarbons, sulfur hexafluoride, and nitrogen trifluoride. In addition to tracking U.S. greenhouse gas emissions, the Inventory calculates carbon dioxide removed from the atmosphere through carbon uptake in forests and other vegetation.
Greenhouse gases are emitted and reported across five economic sectors: transportation, electric power (electricity generation), residential/commercial (homes and businesses), industry, and agriculture. Emissions from commercial/residential and industrial activities account for a much larger share of U.S. greenhouse gas due to their proportionately larger share of electricity use in these sectors (e.g., heating, ventilation, and air conditioning; lighting; appliances; powering industrial machinery).
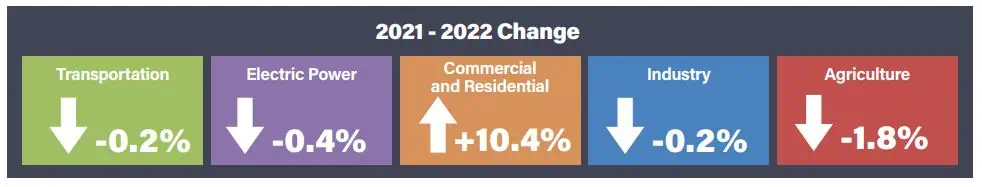
Transportation activities were the largest source (28 percent) of total U.S. greenhouse gas emissions in 2022. From 1990 to 2022, transportation CO2 emissions from fossil fuel combustion increased by 19 percent, largely due to increased travel demand.
The electric power sector accounted for 25 percent of U.S. greenhouse gas emissions in 2022. Emissions from this sector have decreased by approximately 16 percent since 1990, and the carbon intensity of the sector, in terms of emissions (CO2 Eq.) per QBtu input, has decreased by 28 percent. Total electric power generation increased by 3 percent in 2022, while electric power-related emissions decreased by less than 1 percent due in part to a decrease in coal consumed to produce electricity and an increase in renewable generation.
The commercial and residential sectors accounted for 7 and 6 percent, respectively, of total U.S. greenhouse gas emissions in 2022, excluding indirect emissions from electricity end-use. Emissions from these sectors are primarily from building-related activities such as heating and cooking and have increased since 1990. Emissions from commercial and residential buildings also increase substantially when emissions from electricity end-use are included because the building sector uses 75 percent of the electricity generated in the U.S. for heating, ventilation, air conditioning, lighting, and appliances (NREL 2023). Total residential and commercial greenhouse gas emissions, including direct and indirect emissions, have decreased by 1 percent since 1990.
The industrial sector accounted for 23 percent of U.S. greenhouse gas emissions in 2022, excluding indirect emissions from electricity end-use. If indirect emissions from electricity use are distributed to the industrial end-use sector (e.g., powering equipment and industrial buildings), industrial activities account for 30 percent of U.S. greenhouse gas emissions. Since 1990, emissions from industry have declined by 16 percent. Shifts in industrial output away from energy-intensive manufacturing products to less energy-intensive products have had a significant positive impact on industrial emissions.
Agriculture accounted for about 10 percent of U.S. greenhouse gas emissions in 2022 and includes sources such as livestock enteric fermentation and manure management, N2O emitted from managed agricultural soils from fertilizers and other management practices, and fossil fuel combustion from agricultural equipment. Indirect emissions from electricity in the agricultural sector are about 5 percent of sector emissions. In 2022, agricultural soil management was the largest source of N2O emissions, and enteric fermentation was the largest source of CH4 emissions in the U.S. There are several strategies for reducing CH4 emissions from enteric fermentation and manure management, including anaerobic digestion and liquid-solid separation, which the sector is embracing.
A summary of greenhouse gas emissions from the Waste sub-sector is below. In 2022, waste activities generated emissions of 166.9 MMT CO2 Eq., or 2.6 percent of total U.S. greenhouse gas emissions.
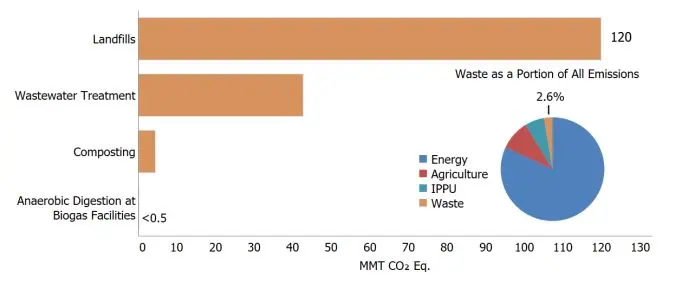
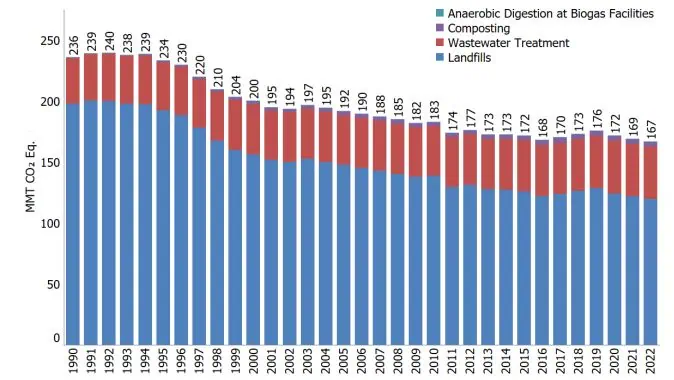
Methane generation and emissions from landfills are a function of several factors. Each landfill has unique characteristics, but emissions from MSW landfills accounted for approximately 84 percent of total landfill emissions (100.9 MMT CO2 Eq.), while industrial waste landfills accounted for the remainder (18.9 MMT CO2 Eq.). Nationally, there are significantly fewer industrial waste landfills than MSW landfills, contributing to the lower national estimate of CH4 emissions for industrial waste landfills.
The annual amount of MSW generated and disposed of in MSW landfills varies annually and depends on several factors (e.g., the economy, consumer patterns, recycling, composting programs, and inclusion in a garbage collection service).
The estimated annual quantity of waste placed in MSW landfills increased by 10 percent from approximately 205 MMT in 1990 to 226 MMT in 2000, then decreased by 11 percent to 202 MMT in 2010, and then increased by 7 percent to approximately 217 MMT in 2022.
Emissions decreased between 1990 and 2022 largely because of increased use of landfill gas collection and control systems, closure of older landfills, better management practices, and increased organics diversion through state and local policy and regulations.
Biogas, Anaerobic Digestion, Renewable Natural Gas and Energy Systems
Carbon Sequestration & Deep Well Injection
CCR and Electric Utilities
Clean Air Act
Facility Energy Management
Greenhouse Gas Monitoring, Control, Inventory
Landfill Gas and LFGE
Liquids Management – Wastewater and Leachate
Material Recovery Facilities and Transfer Stations
Oil and Gas Exploration and Production
Organics Management, Composting
SCS Remote Monitoring and Control® (Emissions Tracking)
SCSeTools® (LFG Tracking)
Solid Waste Planning, Sustainable Materials Management
Sustainable Solutions Planning

Growing consumer demand for environmentally responsible companies that offer new carbon-neutral products and services creates competitive positioning and market value for “green” organizations. In the environmental business, we call this Sustainability.
In addition to complying with regulations and mitigating economic risks, many organizations are concerned about environmental stewardship and corporate responsibility. Our clients provide important services to society; we are pleased to assist them while also helping to minimize adverse environmental and economic impacts.

In this blog, we’d like to introduce you to Erin Quinn. Mr. Quinn has two decades of experience in environmental consulting, specializing in air quality, environmental assessments, and greenhouse gas (GHG) consulting, reporting, and verification. He has participated in over 550 GHG verification projects throughout the United States.
As a specialist in air permitting and reporting, we asked him to step us through the verification process to provide us with time and cost-saving tips while making the verification process smoother.
Erin’s Tips
Check your firm’s qualifications. Seek a firm with a successful record of GHG emissions inventories, estimating GHG reductions, and a thorough knowledge of navigating the Cap and Trade Program. If you are experiencing a gap between your plan and your actual results, they could help identify how to close the gaps depending on their certifications and background.
Go local. For example, on the west coast, look for experience with CARB and ODEQ projects from various industries such as natural gas, coal, biogas and biomass, solar electricity generation, food processing, oil and gas production, electricity and transportation fuels transactions, and paper mills.
Preparation and understanding of a reporter’s GHG emission sources, CARB designation of the facility, or EPE as described in §95101 of the regulations, and any issues the reporting entity may have had while developing its GHG emissions report will facilitate report completion. This takes experience in combination with industry and specific agency requirements.
Investigate that your third-party verification is transparent. Third-Party Verification of GHG emission inventories and reduction credits under state agencies requires an efficient, transparent, and direct methodology for verifying GHG emissions reports.
Steps in the GHG Verification Process
SCS submits a conflict of interest (COI) and notice of verification services (NOVS) to CARB for their approval as soon as an agreement for verification services has been reached. A simple thing, but one that allows us to begin verification service as soon as the reporting entity submits its verification report to the agency, thus streamlining the process.
Next, we set up a kickoff meeting with the reporting entity and a consultant if you’re using one. At the meeting, we discuss the data that will or may, be required for a transparent verification process and documentation. The meeting helps clients understand all the data used in calculating and reporting their emissions, making the data review process seamless. Immediately following, we provide a formal initial data request.
Now we get to work. We begin by reviewing the provided data to develop a verification plan, a sampling plan, and an issues log. We share this with our client and provide any further explanation within the regulatory framework. During this phase, we often communicate with our client as a part of our quality management methodology.
After reviewing and addressing any issues, SCS completes the verification report and has a final meeting with our client within days of receipt so that SCS can submit it to the agency. The end result is a cost-effective, timely, and defendable verification that meets client and agency expectations and all requirements.
GHG Services at SCS Engineers
Our diligence has helped SCS develop excellent working relations with clients, various regulatory agencies, and voluntary registry. Our long experience enables us to understand your needs and how a regulatory agency or registry will interpret an unusual situation.
The firm has delivered verifications for over a decade and has 52 years of environmental compliance expertise for municipalities and industries. Our GHG verification team has completed hundreds of validation and verification projects, from mandatory GHG reporting in California and Oregon; LCFS validation and verification and offset verifications throughout the U.S.
To learn more about the process or to speak with Erin or another team member, please contact us at .
Additional Resources

Reducing CO2 is essential for our planet to thrive. At SCS Engineers, we’ve been helping all industries, cities, and states do just that for over 50 years. We focus solely on environmental solutions; in the industry, it’s called pure environmental, along with industry rankings that consistently rank our results in the top tiers.
Our culture is one of sharing. Our professional staff are involved in their communities and global industry associations where we speak, publish and share what works openly with you. Our newest blog series will publish monthly, bringing you the latest papers, presentations, and case studies on reducing CO2.
SCS clients entrust us with managing more than 35 million metric tons of anthropogenic CO2e greenhouse gases annually. We collect and beneficially use or destroy enough to offset greenhouse gas emissions from 7.4 million passenger cars annually. That’s more than any other environmental firm in North America and proof of the results we can achieve for you.
A Call for Low Impact Development: the Time is Now, SWS 2022 Low impact developments profoundly impact stormwater management while providing more energy-efficient housing.
The Road Ahead: Carbon Sequestration This video features experts in sequestration and inventorying GHG. The sequestration of liquids is common, but gases may also be sequestered.
Potential Geochemical Effects of CO2 and Brine Leakage – Implications for CCUS Testing and Monitoring Live presentation at the National Carbon Capture Conference on November 8-9 in Des Moines, Iowa. Using an inverse thermodynamic modeling approach to simulate the effect of the progressive intrusion of CO2 and brines from the injection zone on the geochemical composition of the overlying dilute aquifer waters; we can infer which geochemical parameters are most likely to be affected by the potential intrusion of CO2 and brines.
Application of Advanced Characterization Techniques for Identification of Thermogenic and Biogenic Gases This paper discusses the identification of thermogenic and biogenic gases, the typical sources and characteristics of methane in the natural environment, and the methods of discriminating between different sources of methane for fingerprinting.
Roadmap for Sustainable Waste Management in Developing Countries, ISWA, 2022 An accomplished team of sustainability researchers deliver a concise insight into modern waste management practices that acts as a handbook for waste management professionals.
Mini-review of waste sector greenhouse gas and short-lived climate pollutant emissions in Tyre Caza, Lebanon, using the Solid Waste Emissions Estimation Tool (‘SWEET’) A completed a study of waste sector short-lived climate pollutants and other greenhouse gas emissions in Tyre Caza, Lebanon, using SWEET.
SCS respects your privacy – you may share these resources individually using social media and email icons on each page. You may share all of the resources by sharing this blog.
Look for our next Preventing and Reducing CO2 blog in September!
CERLCA Jurisdiction and PRP Definition
A recent Meyers | Nave publication discusses the Supreme Court’s April 20, 2020 decision in Atlantic Richfield Co. v. Christian. The firm suggests the decision adds another layer of complexity to the Comprehensive Environmental Response, Compensation, and Liability Act – CERCLA, liability issue. The decision opens the door for state courts to hear claims that challenge EPA-defined approved clean-ups and has the potential to expand the “potentially responsible party” – PRP class for current “owners” of a “facility.”
The Court’s decision introduces new considerations into CERCLA liability analysis and settlement strategy. The Court’s holding will have many immediate ramifications, including the following:
Clean Water Act Developments
In April, the courts and federal agencies announced major developments significantly affecting regulation under the Clean Water Act – CWA and how the CWA may be applied in the future.
Each of these developments could have far-reaching implications for regulations under the CWA. Assuming the 2020 Rule withstands legal challenges, it is seen as favorable for industry and other regulated entities, while the two judicial decisions are perceived as problematic for such entities. Davis Graham & Stubbs describes each development in more detail in the firm’s recently published article.
MATS Supplemental Cost Finding and Clean Air Act RTR
On April 16, 2020, the U.S. Environmental Protection Agency (EPA) finalized the 2016 Supplemental Cost Finding for the Mercury and Air Toxics Standards – MATS, for coal- and oil-fired power plants, consistent with a 2015 U.S. Supreme Court decision. The agency also completed the Clean Air Act-required residual risk and technology review – RTR, for MATS. According to the EPA power plants are already complying with the standards that limit emissions of mercury and other hazardous air pollutants (HAPs), and this final action leaves those emission limits in place and unchanged.
However, with this final action, EPA is not removing coal- and oil-fired power plants from the list of affected source categories for regulation under section 112 of the Clean Air Act, consistent with existing case law. Those power plants remain subject to and must comply with the mercury emissions standards of the MATS rule, which remains fully in effect notwithstanding the revised cost-benefit analysis.
In addition, EPA has completed the required RTR for MATS and determined no changes to the rule are needed to further reduce residual risk. The RTR satisfies the statutory requirements set out by Congress in the Clean Air Act. More information is available on EPA’s Mercury and Air Toxics Standards website.
Proposal to Retain NAAQS for Particulate Matter
On April 14, 2020, the U.S. Environmental Protection Agency – EPA announced its proposal to retain, without changes, the National Ambient Air Quality Standards – NAAQS for particulate matter (PM) including both fine particles (PM2.5) and coarse particles (PM10).
According to the EPA because of Clean Air Act programs and efforts by state, local and tribal governments, as well as technological improvements, average PM2.5 concentrations in the U.S. fell by 39 percent between 2000 and 2018 while average PM10 concentrations fell by 31 percent during the same period.
EPA states it is following the principles established to streamline the NAAQS review process and to fulfill the statutory responsibility to complete the NAAQS review within a 5-year timeframe. More information about the rule can be found at EPA’s: National Ambient Air Quality Standards (NAAQS) for Particulate Matter (PM) Pollution website.
EPA will accept public comment for 60 days after the proposed standards are published in the Federal Register. EPA plans to issue the final standards by the end of 2020.
U.S. Greenhouse Gas Emissions and Sinks Inventory Announcement
The Environmental Protection Agency’s annual report, “Inventory of U.S. Greenhouse Gas Emissions and Sinks: 1990-2018,” provides a comprehensive look at U.S. emissions and removals by source, economic sector, and greenhouse gas – GHG. The gases covered by this inventory include carbon dioxide, methane, nitrous oxide, hydrofluorocarbons, perfluorocarbons, sulfur hexafluoride, and nitrogen trifluoride. The inventory also calculates carbon dioxide emissions that are removed from the atmosphere by “sinks,” e.g., through the uptake of carbon and storage in forests, vegetation, and soils.
On April 13, 2020, the EPA’s comprehensive annual report on nationwide GHG emissions released to the public. It shows that since 2005, national GHG emissions have fallen by 10%, and power sector emissions have fallen by 27%.
“While there was a small rise in emissions due to weather and increased energy demand from the prior year in this report, based on preliminary data, we expect next year’s report to show that the long-term downward trend will continue,” said EPA Administrator Andrew Wheeler.
According to the announcement, annual trends are responsive to weather variability and economic conditions. Year-over-year, national GHG emissions were 3% higher in 2018 than the prior year, due to multiple factors, including increased energy consumption from greater heating and cooling needs due to a colder winter and hotter summer in 2018 compared to 2017.
According to environmental and research groups, driving the drop’s long-term downward trend is chiefly due to a shift away from coal power generation. The 2019 drop was driven by a nearly 10 percent fall in emissions from the power sector, the biggest decline in decades [Rhodium Climate Service]. Utilities are closing coal plants in favor of cheaper natural gas and renewable energy.
Emissions from industry rose slightly last year, and are now greater than those from coal-fired power plants, most driven by a strong economy. Emissions from buildings were up, and emissions from other sectors of the economy collectively grew by more. The shift to lower-carbon energy is largely restricted to the electricity sector, and in order to meet international and state goals, state policies continue to target other sectors that collectively make up a majority of U.S. emissions.
More information is available at EPA’s website Inventory of U.S. Greenhouse Gas Emissions and Sinks.
For more information about potential impacts to waste, energy, or manufacturing please contact your nearest SCS Engineer’s office or your Project Manager.
Corporate Headquarters