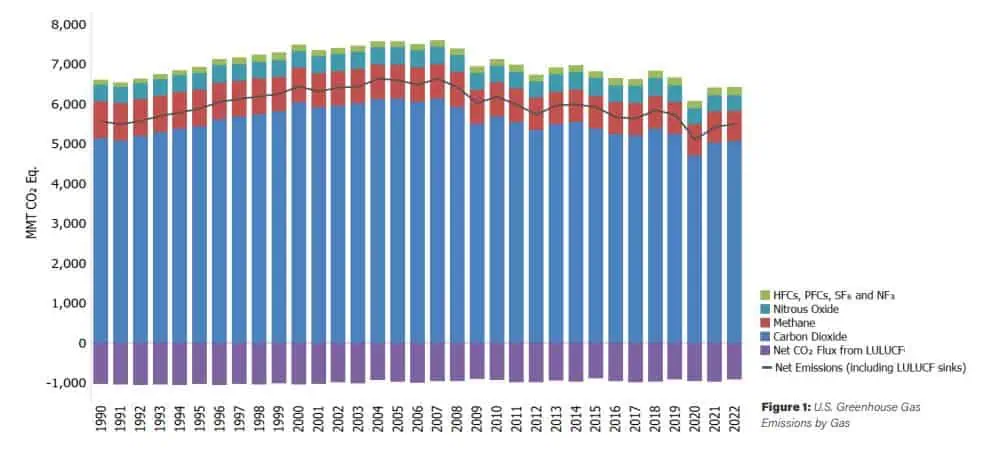
On April 11, 2024, the U.S. Environmental Protection Agency (EPA) released its annual Inventory of U.S. Greenhouse Gas Emissions and Sinks (GHG Inventory), presenting a national-level overview of annual greenhouse gas emissions from 1990 to 2022.
The GHG inventory identifies and quantifies anthropogenic sources and sinks of greenhouse gas emissions and removals, which is essential for quantifying and qualifying data used to address climate change and measure the impact of environmental solutions and sustainability plans. In this context, the term “anthropogenic” refers to greenhouse gas emissions and removals that are a direct result of human activities or are the result of natural processes that have been affected by human activities.
The GHG Inventory covers seven key greenhouse gases: carbon dioxide, methane, nitrous oxide, hydrofluorocarbons, perfluorocarbons, sulfur hexafluoride, and nitrogen trifluoride. In addition to tracking U.S. greenhouse gas emissions, the Inventory calculates carbon dioxide removed from the atmosphere through carbon uptake in forests and other vegetation.
Greenhouse gases are emitted and reported across five economic sectors: transportation, electric power (electricity generation), residential/commercial (homes and businesses), industry, and agriculture. Emissions from commercial/residential and industrial activities account for a much larger share of U.S. greenhouse gas due to their proportionately larger share of electricity use in these sectors (e.g., heating, ventilation, and air conditioning; lighting; appliances; powering industrial machinery).
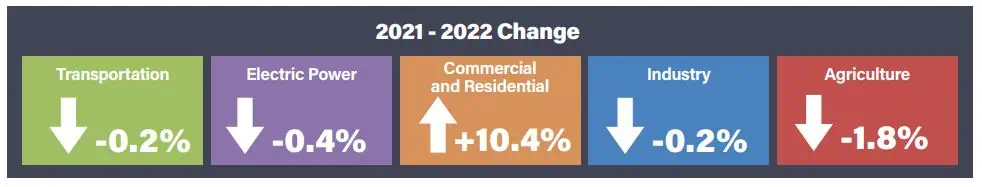
Transportation activities were the largest source (28 percent) of total U.S. greenhouse gas emissions in 2022. From 1990 to 2022, transportation CO2 emissions from fossil fuel combustion increased by 19 percent, largely due to increased travel demand.
The electric power sector accounted for 25 percent of U.S. greenhouse gas emissions in 2022. Emissions from this sector have decreased by approximately 16 percent since 1990, and the carbon intensity of the sector, in terms of emissions (CO2 Eq.) per QBtu input, has decreased by 28 percent. Total electric power generation increased by 3 percent in 2022, while electric power-related emissions decreased by less than 1 percent due in part to a decrease in coal consumed to produce electricity and an increase in renewable generation.
The commercial and residential sectors accounted for 7 and 6 percent, respectively, of total U.S. greenhouse gas emissions in 2022, excluding indirect emissions from electricity end-use. Emissions from these sectors are primarily from building-related activities such as heating and cooking and have increased since 1990. Emissions from commercial and residential buildings also increase substantially when emissions from electricity end-use are included because the building sector uses 75 percent of the electricity generated in the U.S. for heating, ventilation, air conditioning, lighting, and appliances (NREL 2023). Total residential and commercial greenhouse gas emissions, including direct and indirect emissions, have decreased by 1 percent since 1990.
The industrial sector accounted for 23 percent of U.S. greenhouse gas emissions in 2022, excluding indirect emissions from electricity end-use. If indirect emissions from electricity use are distributed to the industrial end-use sector (e.g., powering equipment and industrial buildings), industrial activities account for 30 percent of U.S. greenhouse gas emissions. Since 1990, emissions from industry have declined by 16 percent. Shifts in industrial output away from energy-intensive manufacturing products to less energy-intensive products have had a significant positive impact on industrial emissions.
Agriculture accounted for about 10 percent of U.S. greenhouse gas emissions in 2022 and includes sources such as livestock enteric fermentation and manure management, N2O emitted from managed agricultural soils from fertilizers and other management practices, and fossil fuel combustion from agricultural equipment. Indirect emissions from electricity in the agricultural sector are about 5 percent of sector emissions. In 2022, agricultural soil management was the largest source of N2O emissions, and enteric fermentation was the largest source of CH4 emissions in the U.S. There are several strategies for reducing CH4 emissions from enteric fermentation and manure management, including anaerobic digestion and liquid-solid separation, which the sector is embracing.
A summary of greenhouse gas emissions from the Waste sub-sector is below. In 2022, waste activities generated emissions of 166.9 MMT CO2 Eq., or 2.6 percent of total U.S. greenhouse gas emissions.
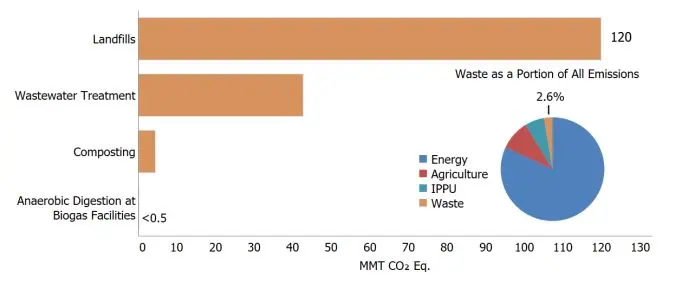
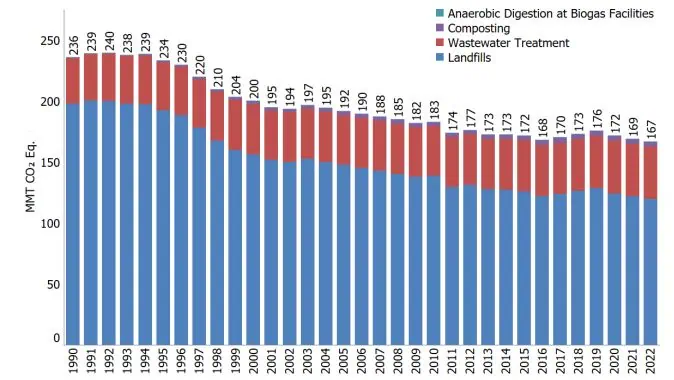
Methane generation and emissions from landfills are a function of several factors. Each landfill has unique characteristics, but emissions from MSW landfills accounted for approximately 84 percent of total landfill emissions (100.9 MMT CO2 Eq.), while industrial waste landfills accounted for the remainder (18.9 MMT CO2 Eq.). Nationally, there are significantly fewer industrial waste landfills than MSW landfills, contributing to the lower national estimate of CH4 emissions for industrial waste landfills.
The annual amount of MSW generated and disposed of in MSW landfills varies annually and depends on several factors (e.g., the economy, consumer patterns, recycling, composting programs, and inclusion in a garbage collection service).
The estimated annual quantity of waste placed in MSW landfills increased by 10 percent from approximately 205 MMT in 1990 to 226 MMT in 2000, then decreased by 11 percent to 202 MMT in 2010, and then increased by 7 percent to approximately 217 MMT in 2022.
Emissions decreased between 1990 and 2022 largely because of increased use of landfill gas collection and control systems, closure of older landfills, better management practices, and increased organics diversion through state and local policy and regulations.
Biogas, Anaerobic Digestion, Renewable Natural Gas and Energy Systems
Carbon Sequestration & Deep Well Injection
CCR and Electric Utilities
Clean Air Act
Facility Energy Management
Greenhouse Gas Monitoring, Control, Inventory
Landfill Gas and LFGE
Liquids Management – Wastewater and Leachate
Material Recovery Facilities and Transfer Stations
Oil and Gas Exploration and Production
Organics Management, Composting
SCS Remote Monitoring and Control® (Emissions Tracking)
SCSeTools® (LFG Tracking)
Solid Waste Planning, Sustainable Materials Management
Sustainable Solutions Planning