When municipalities’ collection routes run like well-oiled machines, trucks make money for them, translating to lower rates for taxpayers and streamlined, effective curbside service. But waste haulers typically lack two potentially powerful tools to gauge efficiencies and inform cost-saving decisions for the most robust collection route optimization.
What’s missing are formal analyses and standardized key performance indicators (KPIs) tailored for this specialized, complex niche.
Some industry experts look to close the gap. They are developing and leveraging KPIs and analyses, aiming for more and better data to drive productivity. They find the two tools work well together: KPIs provide a baseline to inform the comprehensive analysis.
“What we are doing is standardizing the evaluation of collections to quantify performance and outcomes better using more detailed parameters than before,” says Kevin Callen of Route Optimization Consultants. He works with SCS Engineers to improve cities’ collection operations.
New performance parameters fill in where the number of stops, tons collected, and time on route leave off. These are the beginnings of KPIs, but to really tell the story of how well collection routes run, metrics must go deeper to assess near-countless variables potentially impacting outcomes. The human variable –actions of customers, drivers, and helpers – is part of that.
“You can have all the data in the world and have the route worked out to run like a Swiss watch. But the human factor is a wild card,” says Josh Krumski of SCS Engineers.
KPIs Can Peer Into Human Behaviors
Analyzing collection operations through a KPI lens sometimes enables municipalities to understand better the drivers’ judgment calls and how they play out. And it gives insight to help prepare for unpredictable circumstances in this fast-moving, changing industry.
“Ultimately, we are trying to set up methodology and identify best practices to improve route operations as they grow and change. It’s a systematic way to monitor operations closely. To determine if collections are as productive as possible and identify problems and underlying causes if they fall short,” Callen says.
Krumski leverages multiple KPIs to help with his toughest charge: balancing costs and service quality in an industry with a tight profit margin.
“When you see what towns bill to collect waste and recycling, then consider operational costs, it’s clear that if they run behind a few hours a day, it eats into their budgets. Time to get out of the truck, open the corral, service the container, put it back, and close the corral starts to add up,” he says.
SCS Engineers use KPIs to gauge more than what happens at curbside stops, leaning on them to provide objective, big-picture insight to municipalities too busy to vet as they run their daily operations. Below are KPIs that the team finds best to help inform their collection route optimization projects.
Maximum Dumps
At the top of the list is the maximation of dumps, which is about loading trucks to full capacity while minimizing commute time to and from disposal sites.
Crews should optimally do three dumps during a typical 10-hour route and two during an average eight-hour route. If they aren’t achieving this, the question is, how might they be able to?
Packout Ratio
Look for the answer in the packout ratio. This KPI defines the weight of waste in the truck versus the maximum weight it can hold. Using its full capacity more often is one way to work within a tight profit margin.
The key to getting ultimate packout ratios is distributing customers associated with long travel times across multiple routes. The distribution enables workers to fill trucks quickly, dump, and get back on their routes—not easy to do on a continuous long haul as there isn’t time to packout trucks. But with well-planned, evenly distributed courses, haulers achieve packout ratios of 85-90% to 100%. Callen says that the higher percentages translate to less trekking to and from the landfill and more time knocking off collections.
Workday Utilization
Workday utilization is the percent of the day spent completing a route, divided by scheduled hours in the day.
With seven hours typically dedicated to the job, there is little slack to tug on to expand routes. As you aim to increase productivity, be careful to avoid long days and overtime, Callen advises, especially considering you must factor in weather, truck issues, and fluctuations in set out weights, among other often unexpected circumstances that add time.
Further, Krumski cautions, “You can only be behind the wheel so many hours a day, or you fall into a Department of Transportation safety violation.”
Ensuring evenly balanced workloads helps. Krumski looks at performance data to identify drivers who may finish in eight hours and those spending 10 hours on the road.
“When I see this disparity, I ask, where and how can we change up routes for a better workday balance and get people in simultaneously? For instance, if someone broke down, another driver can pick up the load.” He looks at automation, asking if he can change any part of the route to automatic side loaders (ASL) to rely less on pickers.
Service Time
Service time is hours spent only driving the route and collecting. That’s the most obvious job, but only part of what workers do during a collection day.
Haulers do their best to maximize service time. But mitigating factors weigh in, Callen says. Workers have about four hours a day to focus solely on collecting, spending their remaining time traveling to and from disposal/recovery facilities, waiting in line there, servicing their vehicles, on required breaks, etc.
One best practice is to shoot for route times that are 30 minutes shorter than the planned workday. Here, automation may again come into play. Asking customers to schedule bulk pickups saves time too.
Route Balance
Design routes to maximize weight, fuel, miles, and time.
Krumski leverages this KPI to explore if and how he might redistribute stops on each route to be as uniform as possible while considering these four factors.
An example is having two trucks serving the same route. Due to their size, the trucks have limited maneuverability, sometimes only able to pick up on one side of a street. When two trucks serve the same route, they don’t need to double back or drive around several times.
A route balance entails diving into multiple metrics. Krumski exemplifies this with a client scenario: there are two routes; one with 1,000 stops; another with just over 500. But they are balanced because there is less distance between the 1,000 stops.
“The route with fewer stops drives several miles uninterrupted, so the picker can’t ride on the back, which takes time. If you have several hundred consecutive close stops where the picker can ride on the step and quickly get into and out of the truck, you’re fine,” Krumski says.
So besides stops, he looks at the distance between stops, time to complete a route minus downtime, and especially watches whole-route weights.
“If weights are wonky and routes with heavier loads are trailing, that’s when we focus more on weights to balance routes,” Krumski says.
“But while weight is a big factor, it’s not everything, as seen in comparing the two routes where the one with the lesser units stopped much more frequently. And sometimes, weather or different human elements throw a wrench in your plan. I saw a lot of that during COVID.”
Collection Day Balance
This KPI refers to the range of time between the minimum and maximum cumulative times spent servicing all routes on a collection day. Getting that range entails looking at the fastest and slowest routes for each day.
A major discrepancy between the fastest and slowest crews calls for evaluation. Is it a routing issue, a collection issue, or a human issue? And is an adjustment needed?
Collection days and routes should be adjusted when one day requires an additional truck.
“Let’s say you have a tri axle servicing a route in two dumps. It goes down, so you have to send in two smaller trucks. Or you need a smaller truck to navigate alleys or side streets due to detours or other circumstances requiring negotiating smaller spaces. You use a larger truck for main routes and a smaller truck for problem areas,” Krumski says.
Distance and cost to dump also commonly come into play. Sending multiple trucks to dump once may save money over having one larger truck dump multiple times.
Keeping up with Changes
While KPIs quantify performance and help inform best practices, achieving good outcomes requires keeping up with changes. Ongoing training is a must.
“When I ask drivers why they made a given decision, they routinely say it’s what they were taught. That instruction sometimes comes from someone who hasn’t been with the company in years. Best practices have to evolve to keep up with changes in community development and new technologies,” Krumski says.
The trash industry excels when it evolves as a whole. Using KPIs and existing technology has great potential to influence change and improve daily routes.
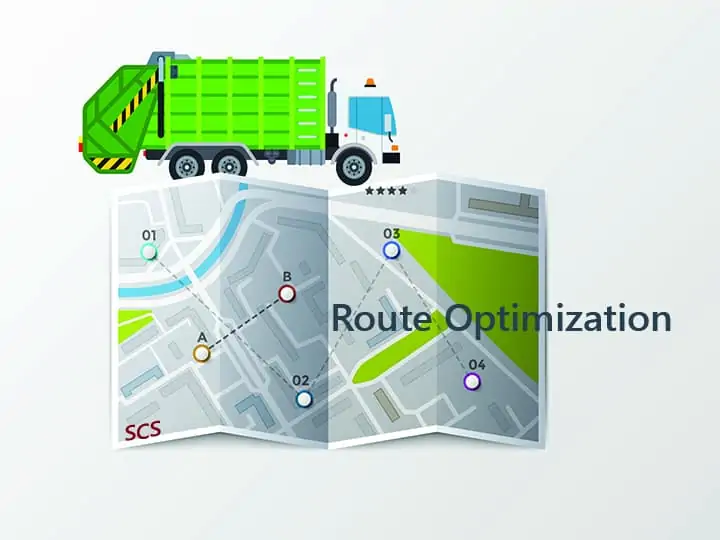
Route Optimization for Waste Collection Finds Surprising Benefits for Even Small Municipalities
Running optimized collection routes is critical for a waste company’s or municipality’s bottom line; it’s also a dauntingly complex job. This is where experts skilled in waste collections route optimization come in. There could be thousands or more ways to get from one service point to the next along a single route; now think about an intricate web of routes traversed by a whole fleet. Then throw in other possible variables, like different route densities, overlapping vs. non-overlapping routes, and holiday and inclement weather schedules. And if you are like one fast-growing Midwestern city, you have plenty more to take on as you work to stay on top of that growth and changes that come with it.
Geographical Information Systems (GIS) help achieve collection route optimization.
One way this Midwest municipality stood up to the challenges is with GIS, which stores, processes, analyzes, and maps spatial data. SCS Engineers’ Emily Smith helped the city leverage the technology to identify and make needed changes, better serve customers, and ultimately save money and time.
“When we came in to help, they had multiple small routes scattered across their service area, which was a problem that became more difficult as the city was growing. Haulers were putting in a lot of overtime to meet deliverables while complying with regulations restricting driving hours. They needed to take more breaks between driving time to stay within those limits, which stretched out their days further,” Smith says.
“Then there’s the wear and tear on tires and the trucks themselves and fuel cost, among issues.”
Working with route optimization consultant Kevin Callen, she used GIS to help restructure and better balance routes.
An ecologist, Smith started using the technology years ago to map out wetlands and for groundwater monitoring. That gave her the knowledge base to figure out how to develop maps to optimize collection routes; these powerful systems are flexible, with broad capabilities and applications.
“I like identifying where there is room for improvement and making visual representations of projects so clients can see the scenario as more than numbers on a page. It tells a story and makes it easier to grasp when they have a visual, color-coded representation,” Smith says.
GIS is useful to map out garbage carts and recycling carts down to an individual customer or street and the number of houses in a neighborhood. It can identify one-way streets or low bridges that larger trucks may need to bypass, among relevant information to plan the most efficient paths. We layer these details and other customizable data to get a comprehensive picture to help design the plan.
Smith began by teasing out information that the city already had. Using surveys created with targeted questions, she could obtain information about specific route challenges (tight alleyways, street parking, confusing setout locations, etc.). The information helped inform potential route modifications.
The outcomes for the Midwest municipality:
Existing waste routes can be modeled in GIS and revised that show impact before and after revisions under consideration. This capability extends beyond fine-tuning residential collection routes. For instance, GIS can do geoprocessing of data to calculate where to put a recycle drop-off center or transfer station that will service a given number of customers.
Additional supports weaved into GIS.
Besides saving labor, travel time, and fuel and vehicle maintenance expenses, routing has more qualitative aspects of gaining efficiencies.
“By talking to collectors with boots on the ground, we find ways to enhance driver safety by identifying problem areas like locations prone to flooding and those with low-hanging tree branches or power lines. Leveraging GIS can also help reduce truck impacts to roads and neighborhoods and reduce emissions. And it can help address customer service issues — for instance, by mapping and taking notes on special backdoor service customers with limited mobility, collectors know to pick up their bins closer to their homes,” says Ryan Duckett, an SCS engineer who leverages GIS to support clients on the East Coast.
For one Texas city, it was a way to systematically and quickly clean up volumes of existing data that had inaccuracies. This was key to later being able to perform an analysis providing intel for route load balancing.
“There were approximately 200 points that needed to be updated to reflect their actual locations. We provided a method to verify and change the information via an online interactive GIS mapping application. They can edit each field, inputting appropriate route information,” says SCS’s Brooke Aumann, who has 14 years working with GIS. The municipality used this same system to review the new routes and provide comments, allowing its staff to be an active collaborative partner in optimizing each route, Aumann says.
Curbside waste collection is hard work. It involves a lot of physical labor, operating heavy equipment, adhering to tight schedules, and sometimes pivoting fast.
“Having this powerful tool that enables us to streamline the process and make collections easier and more efficient is a big plus, especially as we continue to expand and improve other waste and recycling services that depend on, or impact, collections. GIS is a unique opportunity to apply computer technology to come up with practical approaches to real-life problems and realize substantial savings in time and money,” Duckett says.
Corporate Headquarters