EPA will hold three complementary competitions to strategically distribute grant funding under the $27 billion Greenhouse Gas Reduction Fund program. EPA will implement these programs in alignment with the President’s Justice40 Initiative and expects to open competitions for funding under the Greenhouse Gas Reduction Fund by the summer of 2023.
The goal is to ensure that households, small businesses, schools, and community institutions in low-income and disadvantaged communities have access to financing for cost-saving and pollution-reducing clean technology projects. EPA aims to deliver tangible benefits, including lower energy costs, good-paying jobs, and improved public health outcomes to households, businesses, and communities. The three competitions will be:
EPA Feedback and Listening Sessions
EPA invites written technical feedback and comments on the competition descriptions as the Agency prepares the program for release as early as June 2023. Stakeholders may send their written feedback to by 11:59 pm ET on May 12. Over the next two weeks, EPA will convene six public listening sessions on this implementation framework. Listening session details and other information about the program are on the GGRF website.
Additional Greenhouse Gas Reduction Resources
Join SCS Engineers professionals at the 2023 Annual Florida Brownfields Conference, June 19-21, at Avanti International Resort in Orlando, Florida.
The Florida Brownfields Conference always brings great information from industry experts. The Call for Abstracts was extended through Friday, May 19. Organizers are seeking presentations on
Registration is now open. For registration information and more details as the conference takes shape, click here.
Hope to see you there!
The Climate Registry is hosting its 2023 Climate Leadership Conference (CLC) and Awards in Los Angeles, May 10-12, 2023.
The annual Climate Leadership Conference is North America’s premier event dedicated to addressing the climate crisis through policy, innovation, and business solutions. Hosted by The Climate Registry, the conference brings together forward-thinking leaders from business, government, academia, and the non-profit community to explore energy and climate solutions and opportunities, and to showcase climate leadership.
Themes emerging for the conference include the critical and growing acknowledgement that corporations and other subnational actors must continue stepping up and taking a central role in the fight against climate change. This theme will be carried over and expanded into next year’s Climate Leadership Conference and Awards.
Click for more conference details as the conference takes shape
Reducing CO2 is essential for our planet to thrive. At SCS Engineers, we’ve been helping all industries, cities, and states do just that for over 50 years. We focus solely on environmental solutions; in the industry, it’s called pure environmental, along with industry rankings that consistently rank our results in the top tiers.
Our culture is one of sharing. Our professional staff are involved in their communities and global industry associations where we speak, publish and share what works openly with you. Our newest blog series Preventing and Reducing CO2 publishes monthly, bringing you the latest papers, presentations, and case studies on reducing CO2 and targeting climate change.
We hope you find this collection of article, papers, videos, and opinion pieces helpful. The opinion pieces raise logical questions and help us create sustainable solutions rather than quick fixes that don’t stand up economically over time. We include a broader range of topics for landfills, as they diligently work toward reducing CO2 and using proven wastewater treatment options.
Sustainable Living Key to Tackling Climate Change Tackling Climate Change: ISWA’s James Law explains how changing people’s mindsets and behaviors impacts climate change …
The Wise Way to Fight Inevitable Climate Change This opinion piece in the Pittsburgh Post-Gazette by Joseph Duckett describes two major reasons why we need to rethink a country-by-country strategy to fight climate change …
Landfill PFAS Study: Concentrations After Leachate Treatment The objective of this study was to evaluate a cross-section of full-scale on-site landfill treatment systems to measure changes in PFAS concentrations. Leachate samples were collected before and after treatment from 15 facilities and were evaluated for 26 PFAS, including 11 perfluoroalkyl carboxylic acids (PFCAs), 7 perfluoroalkyl sulfonic …
Design to Maximize Landfill Air Space – Your Landfill’s Golden Egg Free Webinar and QA Forum: Modern Landfill Design for Siting and Maximizing Air Space The trend to go larger necessitates more landfill design sophistication and master planning to recoup the growing capital investment upfront. During this month’s SCS Engineers webinar and open forum, our panel will discuss how extending the life of a landfill is a greener option …
EPA’s Brownfields Cleanup Grants $60M – Deadline November 22 Brownfields redevelopment and land recycling cleans up past activities that occurred on properties impacting local ecosystems. These properties help revitalize areas economically while making them safe again. When you’re looking at energy as well as environmental costs, remediation is often greener. The FY 2023 Brownfields Multipurpose, Assessment, Revolving Loan Fund, and Cleanup Grant Guidelines are now available (go to Open Solicitations). The application submission deadline is November 22, 2022.
SCS respects your privacy – you may share these resources individually using social media and email icons on each page. You may share all of the resources by sharing this blog. Look for our next Preventing and Reducing CO2 blog in October! If you missed our August issue – no problem, click here.
Reducing CO2 is essential for our planet to thrive. At SCS Engineers, we’ve been helping all industries, cities, and states do just that for over 50 years. We focus solely on environmental solutions; in the industry, it’s called pure environmental, along with industry rankings that consistently rank our results in the top tiers.
Our culture is one of sharing. Our professional staff are involved in their communities and global industry associations where we speak, publish and share what works openly with you. Our newest blog series will publish monthly, bringing you the latest papers, presentations, and case studies on reducing CO2.
SCS clients entrust us with managing more than 35 million metric tons of anthropogenic CO2e greenhouse gases annually. We collect and beneficially use or destroy enough to offset greenhouse gas emissions from 7.4 million passenger cars annually. That’s more than any other environmental firm in North America and proof of the results we can achieve for you.
A Call for Low Impact Development: the Time is Now, SWS 2022 Low impact developments profoundly impact stormwater management while providing more energy-efficient housing.
The Road Ahead: Carbon Sequestration This video features experts in sequestration and inventorying GHG. The sequestration of liquids is common, but gases may also be sequestered.
Potential Geochemical Effects of CO2 and Brine Leakage – Implications for CCUS Testing and Monitoring Live presentation at the National Carbon Capture Conference on November 8-9 in Des Moines, Iowa. Using an inverse thermodynamic modeling approach to simulate the effect of the progressive intrusion of CO2 and brines from the injection zone on the geochemical composition of the overlying dilute aquifer waters; we can infer which geochemical parameters are most likely to be affected by the potential intrusion of CO2 and brines.
Application of Advanced Characterization Techniques for Identification of Thermogenic and Biogenic Gases This paper discusses the identification of thermogenic and biogenic gases, the typical sources and characteristics of methane in the natural environment, and the methods of discriminating between different sources of methane for fingerprinting.
Roadmap for Sustainable Waste Management in Developing Countries, ISWA, 2022 An accomplished team of sustainability researchers deliver a concise insight into modern waste management practices that acts as a handbook for waste management professionals.
Mini-review of waste sector greenhouse gas and short-lived climate pollutant emissions in Tyre Caza, Lebanon, using the Solid Waste Emissions Estimation Tool (‘SWEET’) A completed a study of waste sector short-lived climate pollutants and other greenhouse gas emissions in Tyre Caza, Lebanon, using SWEET.
SCS respects your privacy – you may share these resources individually using social media and email icons on each page. You may share all of the resources by sharing this blog.
Look for our next Preventing and Reducing CO2 blog in September!
Cutting food loss and waste is widely recognized as one of the most powerful levers we have to address climate change and preserve our natural resources. In the United States alone, surplus food accounts for 4% of our greenhouse gas emissions, 14% of all freshwater use, and 18% of all cropland use. We’re wasting precious resources to produce and ship food only to have it end up in a landfill or rot in a field. [ReFED]
These are key action areas where the food system can focus its efforts over the next decade to prevent, rescue, and recycle food at risk of becoming waste. Strengthening food rescue and recycling anything remaining into compost or anaerobic digestion facilities creates beneficial by-products.
The USDA offers grants of up to $300,000 to composting and food waste reduction pilot projects benefiting community food waste and production programs.
Eligible projects can be in rural, urban, and suburban communities. The application deadline is fast approaching on September 1, 2022. USDA anticipates making selections by October 30, 2022, and executing the grant awards by February 8, 2023.
Visit SCS Engineers to learn more about this grant opportunity, check program qualifications, and sign up for free consulting supporting communities interested in this unique USDA grant program.
USDA GRANT for Composting | Food Waste Reduction ELIGIBILITY CRITERIA and RESOURCES
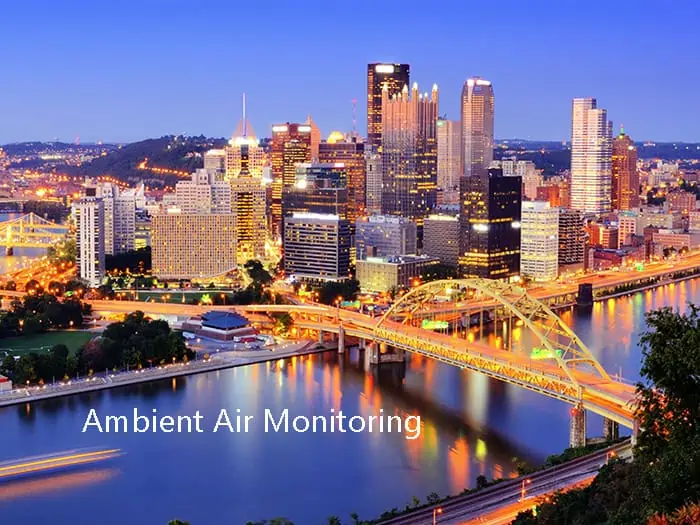
The 2022 NAAMC, sponsored by US EPA in conjunction with the Association of Air Pollution Control Agencies and the National Association of Clean Air Agencies, is a must-attend event for federal, state, local, and tribal air pollution organizations involved with operating, planning, or managing air monitoring networks and reporting data to AQS, and AIRNOW.
In addition to essential training on air monitoring topics, these SCS Engineers professionals will present the following sessions:
Sergio Valenzuela – Quantifying Salton Sea’s Harmful PM During High Wind Events
This study analyzes the correlated TEOM data (centric to high wind event days) and PQ200 data in comparison with TEOM data during “clear” (≤5-mph) days to determine the concentration levels of PM created during high wind events. Also, the incorporation of wind rose diagrams, created using wind speed/direction data collected at meteorological towers, aids in understanding varying PM concentrations relative to their deployment site properties. This study provides an essential tool for understanding the amount of exposure that neighboring communities are experiencing during high wind events and how IID’s implemented mitigation efforts will look moving forward. Read the abstract.
Jose Landeros – Air Monitoring in Mexicali, Mexico. The Evolution of Air Pollution Monitoring in a Border City.
Advancements in technology have influenced the way air pollution is measured and how air pollution data is received, shared, and acted upon by stakeholders. Using Mexicali, México as an example, this presentation will review the evolution of the air pollution monitoring technologies used to measure and inform stakeholder actions. Stakeholders now can access real-time air quality data from platforms that integrate information from low-cost sensors and regulatory sites. The evolution of technology for measuring and presenting data has been remarkable – from large, manual, analog equipment to small, automated, digital equipment with communication systems that allow for real-time data access. Read the abstract.
Additional Resources:
Governor Pete Ricketts has recently made appointments to fill Nebraska’s boards and commissions, including Michael J. Miller to the Governor’s Council to Keep Nebraska Beautiful (KNB). This is Miller’s third term on the nonprofit’s Board of Directors.
Mike Miller is a Vice President and Project Director in SCS Engineers’ Omaha, Nebraska office. As an environmental due diligence expert, he provides environmental management and consulting to the private and federal sectors. These services help municipalities, businesses, and industries operate efficiently and cleanly. He develops and implements environmental health & safety programs and solutions at industrial facilities in the agricultural processing, chemical processing, distribution/transportation, metals, and pharmaceutical manufacturing sectors.
An avid outdoorsman, Mike is a big fan of the School Chemical Clean-Out program and is impressed that KNB has affected projects at hundreds of schools. There is a big need for technical and financial support, and this program provides both for schools large and small, urban and rural, public and private.
Miller has this to say about getting his start on the Keep Nebraska Beautiful Council in 2013,
A landfill client of mine got me involved with KNB through its annual golf event. As an environmental consultant to the solid waste sector, I was very impressed by and supportive of his and his company’s support of KNB and the Mission to ‘take actions to improve and beautify our communities’ to promote healthy environments to live, work, and play within.
Nebraska is making great strides toward cleaner, greener, and more beautiful places to live through Keep Nebraska Beautiful. The nonprofit coordinates events in the State of Nebraska, such as the Great American Cleanup, America Recycles Day, Recycle Bowl, and National Planting Day. This effective community partnership includes representation from the public, private, and civic sectors.
Over the years, local affiliates throughout the state have joined Keep Nebraska Beautiful as Keep America Beautiful affiliates. These include educational and community-improvement programs addressing local needs such as litter awareness, cleanups, beautification, reuse and recycling programs, and neighborhood revitalization.
Successful organizations like these are sustainable through the generous support of their members and supporters like Mike Miller and you. Join in, or see what’s happening in your community.
We’re proud of Mike and all the staff at SCS Engineers who serve our communities and clients.
Addressing the environmental impacts on communities worldwide requires innovative and sustainable solutions guided by science. The Air & Waste Management Association (A&WMA) is a leading environmental policy and technology association. A&WMA’s annual conference brings environmental scientists, engineers, and regulators together to share the latest initiatives addressing communities’ environmental issues.
One of the conference highlights is the Air and Waste Environmental Challenge International (ECi) Competition. ECi gives student teams experience by proposing effective solutions to a simulated environmental problem based on real-world site conditions and events. This year’s competitors were:
The Challenge
Assuming the role as the new Governor of California, the student’s assignment was to choose a sustainable approach to regulate emissions from watercraft and reduce air quality impacts on port communities. Each student team described and justified their chosen program over other options.
This year’s challenge is the Bay Area, where San Francisco and Oakland have large ports with significant populations residing in portside communities. Each team’s research includes existing and proposed studies, policies, laws, and regulations related to emissions from port-related activities and their health impacts on portside communities at the federal and state level, including a critical review of California’s current regulations.
The Judges
The teams presented their solution to a panel of environmental professionals at the Annual Conference this week. Judges included environmental air monitoring experts and those from specialty practices such as technology, sustainability, and regulations. Impressed with the presentations from each school – choosing the ultimate winner was challenging.
All This Suspense – Who Won?
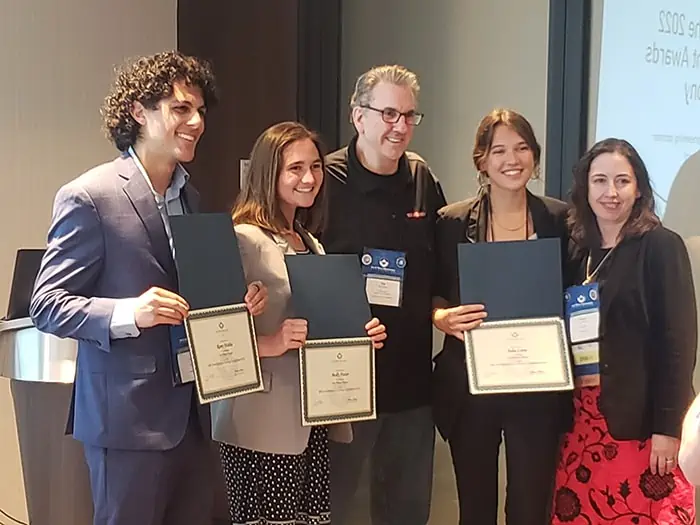
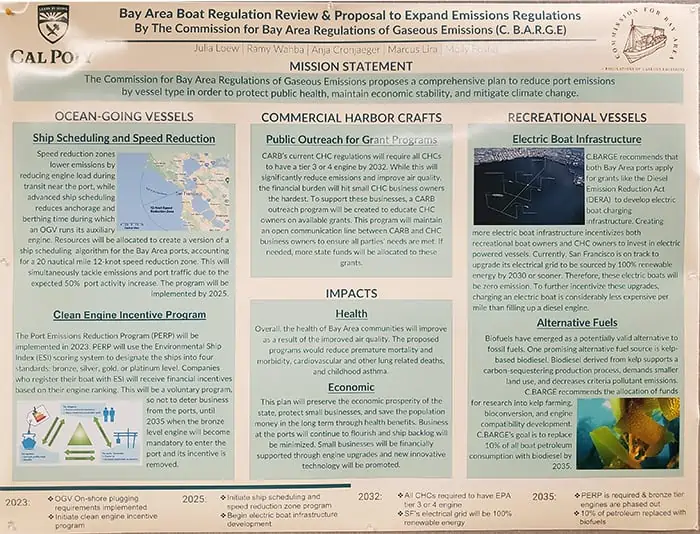
The team from California Polytechnic State University, San Luis Obispo, was selected this year. Cal Poly’s team members include Julia Loew, Ramy Wahba, Anja Cronjaeger, Marcus Lira, and Molly Foster.
Cal Poly’s solution addresses all watercraft with practical elements, including scheduling, speed, education, outreach, and technology. And to create a sustainable solution also addresses economic issues, impacts, and funding sources. The team presented their solution using an infographic (shown below), clearly presenting the path forward year after year.
We congratulate each A&WMA ECi team for their creative and thoughtful presentations. Our communities are in good hands with these soon-to-be professionals.
Save the Date for Land Recycling!
Seize the opportunity to meet with colleagues working to reuse, rebuild, and revitalize communities through land recycling! This June, the Center for Creative Land Recycling (CCLR), U.S. EPA Region 9, and the CA Department of Toxic Substances Control’s (DTSC) Office of Brownfields will host the third California Land Recycling Conference (CALRC) in person in Carson, CA. The Conference offers an exciting space to learn, connect, and be inspired.
CALRC will focus on the most timely issues unique to California and resonate with the national big-picture, including affordable housing, vapor intrusion, funding, and equitable development. As evidenced by the Bipartisan Infrastructure Law (BIL), Build Back Better, and other federal and state revitalization priorities, we see historic investment in brownfields, climate, and economic revitalization. And California is leading the charge.
Come reuse, rebuild, and revitalize! Save the date for June 21-23, 2022, in Carson, CA!
Corporate Headquarters