SCSeTools® – Developed by Landfill Gas Practitioners for Landfill Owners and Operators
The Birth of LFG Data Tracking
In the early 2000s tracking landfill gas data at facilities was anything but uniform, organized, or secure. The industry was using various methods to track data on paper forms and logbooks, then transferring it by hand into spreadsheets. Some of us used desktop database applications, but as the saying goes, necessity is the mother of invention.
From an SCS employee’s idea for demonstrating how to use landfill gas monitoring data to analyze and pinpoint system corrections, SCS DataServices® was born. In the span of several months, a team of SCS’s landfill engineers, field technicians, and technology gurus worked with client-needs to create a concept application visualizing collected landfill data on maps. Our staff field-tested it with good results, and SCS Field Services began using the application to visualize issues with wellfields that aren’t readily apparent when looking at spreadsheets.
A large SCS landfill client had seen our field staff using DataServices, asked if SCS would consider providing them with access to the application on a subscription basis. Our team adapted DataServices, added features, and continued improvements tailored for the client’s use.
As soon as secure data transfer became feasible, SCS moved to an Internet-based solution for our landfill gas practitioners. The platform called SCSeTools® holds the data collected by SCS DataServices®.
Applications and features roll out as we continually update and upgrade, incorporating ideas and improvements from our users and staff along the way. DataServices is addressing the landfill gas management needs of over 600 landfills across the US and Canada in 2021.
The keys to success follow our mission and values of maintaining close communications with our clients, field staff, engineers, and eTools support staff (all landfill gas practitioners), with the help of software engineers. Technology companies are not up at night thinking about landfill operations, but we are.
We introduce our SCS eTools landfill technology capabilities and a few of the creative and talented SCSers behind the technology in the next segment. Our speakers walk you through demonstrations of how over one-third of the landfill owners and operators in North America are increasing efficiencies using SCS eTools.
Visualizing Landfill Challenges – Shortcuts to Keeping Your Wellfield in Balance
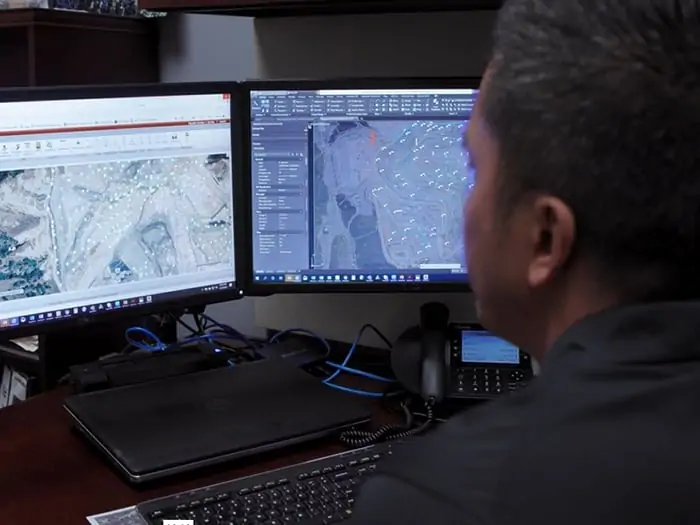
DataServices shows the entire wellfield for any monitored parameters and zooms in on troublesome areas or wells. Results can be as simple or detailed as the landfill owners’ environmental and business needs dictate. The detailed examples here illustrate how graphs, maps, and charts help keep the wellfield in balance. We link each challenge to the description of a video demonstration.
In balance means extracting more gas for renewable energy, preventing odors and methane migration, keeps subsurface and surface conditions and workers safe. The information can help diagnose equipment conditions before they become costly, maintain regulatory compliance, and support cost estimates if the landfill is expanding or more infrastructure investment or equipment is needed.
Looking at vacuum distribution across a gas collection system – Select the system pressure map, which highlights vacuum distribution across the wellfield to show the wells with good (expected) vacuum, pressure drop over distance, and any wells unexpectantly losing vacuum. Zooming in and changing the vacuum ranges further enhances where to assign staff to troubleshoot any identified issues.
Using a methane distribution map shows whether the wells are tuned to where the landfill owner wants them. Wells may be identified below the targeted range, indicating slight over pulling; a technician can use this map to identify such issues and quickly check the identified wells. Wells identified above the desired methane tuning range indicate wells not collecting enough gas, which has consequences. These wells can be the source of odors, leachate seeps, possible lateral migration to an out of waste probe. Not sending enough fuel to a power plant or atmospheric releases can affect surface emissions monitoring.
Managing liquids – Changing waste streams and more rainfall in certain areas of the country complicates liquids management. DataServices visualizes the impacts of liquids on wells and helps landfill owners better manage a proper liquids removal program. The program will let them know how many pumps to budget for and, over time, where to relocate well dewatering pumps so that they are most efficient at removing liquids from landfills.
High-BTU Gas Plants –Filter maps help users locate wells contributing to gas dilution into renewable energy plants. It can help create punch lists for landfill staff to investigate, troubleshoot and tune. As wellfield technicians make corrections, they show on the map in real-time.
Temperature and subsurface oxidation events – Some call the condition subsurface fires, but this is a serious issue for landfills. Over-pulling wells, damaged infrastructure, and other conditions can cause oxidation events. Using a combination of temperature Parameter Maps to review wellhead temperature distribution and a Points Chart feature provides a deeper dive into the data. It provides more insight into which well or wells may be contributing to the high-temperature issues.
Locating a specific well – That’s not so easy when hundreds of wells surround you and at larger landfills. DataServices had built-in filter features to identify a single monitoring point on a wellfield map easily.
Customizing for compliance, best practices, and rules – DataServices allows monitoring points across a single site to have customized rules for each monitoring point. Rules can be for regulatory purposes, standard operating procedures, best management practices, and even site-specific preferences or any combination thereof. It is efficient to customize rule application to landfills and collection points – meaning wells, probes or ports, horizontal collectors. This customization capability helps organize and confirm regulatory compliance. It is especially salient with the 2021 EPA and state compliance changes for a single landfill or an organization with hundreds of landfills.
MobileForms – Inspection forms, blower flare station monitoring forms, load tracking from municipalities, incoming hazardous waste tracking, MRF bale counts are examples of paperless entry available. The data feeds directly from mobile phones to the supervisor and into the maintenance department, so staff can start cataloging and looking at what’s going on in real-time at several types of facilities. It’s available for regulators and inspections and helps reduce staff hours tabulating and centralizing the information. Any information historically captured on a form or log attached to a clipboard can now be captured and stored electronically. From there, it can be recovered and produced as a PDF export file or data from the forms used to trend data and help make informed operational decisions.
MobileTools – DataServices in a condensed format suitable for mobile devices. Field staff use MobileTools to save time formerly used to return to the office, transfer/transcribe the collected data and upload it to a supervisor for quality checks before storage. Technicians can now recall the last 20 readings for any given well and review trend graphs on their phones or tablets while standing adjacent to the well they have questions about and need to access the data. MobileTools also allows them to upload field data such as liquid level readings while the data is being collected. The information instantly populates into DataServices and is available for review by others on the project team.
The most valuable tools are in development now for release in 2022. ARC GIS integration developed under SCS RMC® will further enhance DataServices with even better visualization and location capabilities and provide enhanced features such as allowing landfill owners to see their well as-built information and view subsurface information about their wells.
Learn more at SCS Engineers, where we adopt our clients’ environmental challenges as our own.
California’s AB 32 legislation has proven to be one of the most successful legislation in the U.S. regarding statewide efforts to reduce GHG emissions. This has been started with the implementation of the early action measures stated in the Scoping Plan, which included early regulations to reduce GHG emissions in many different industry sectors, and then moved to the establishment of the MRP and C&T programs, which have created incentives for facilities to reduce their GHG emissions. The nine early action measures have been documented to reduce California’s GHG emissions with an estimated reduction of 13.16 percent from 1990 emissions in the year 201813. As a result of these programs’ implementations, California has met its goal to reach 1990 emissions levels by 2020 and had done so by 2016, four years before its proposed target year.
With the continued implementation of new programs at the state, local, and federal level, growing economic incentives to reduce emissions, and drive that led to the success of the emissions reduction goals of AB32, California is on a very promising path to achieving its latest goals to combat climate change.
Opportunities to Learn More
Co-authors: Karen Luken of Economic Environmental Solutions International, an SCS consultant with Krista Long, Mike Miller, Anastasia Welch of SCS Engineers.
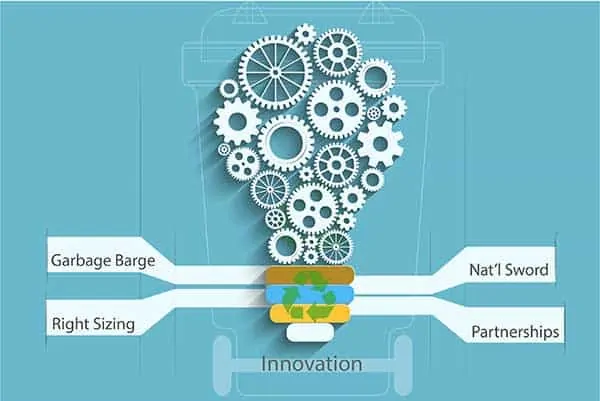
In 1987, the Mobro barge was carrying six million pounds of New York garbage. Its final destination was North Carolina, but the state turned it away. The Mobro barge spent the next five months adrift – rejected by six states and three foreign countries. The plight of the “Garbage Barge” was covered by the mainstream media throughout the summer. This unprecedented attention to trash generated a heated national debate about landfill capacity and recycling to reduce the municipal solid waste (MSW) stream. This dialogue swiftly and permanently transformed recycling in the U.S.
Between 1988 and 1992 alone, the number of curbside recycling programs increased from 1,050 to 4,354. Today, 49 U.S. states ban at least one product from landfill disposal, and twenty-seven states and the District of Columbia have at least one mandatory recycling requirement. The U.S. recycling rate has steadily increased from the Garbage Barge era; by 2017, the U.S. recycling rate reached 35.2 percent, with more than 94 million tons diverted from landfill disposal (67 million tons recycled and 27 million tons composted).
The U.S. was becoming increasingly proficient at collecting recyclables; however, our performance in domestically remanufacturing these resources into valuable commodities was less than stellar. China was the main destination for U.S. recyclables for most of the early twenty-first century. A number of factors contributed to this, including:
By 2018, China was the top importer of U.S. fiber recyclables, buying 2.73 million tons of U.S. corrugated cardboard during the first half of 2018 and 1.4 million tons of all other U.S.-sourced recovered fiber during the same time. The U.S. became dependent on China to process fiber recyclables, which contributed to the closure of 117 American fiber mills and the elimination of 223,000 jobs since 2000.
Sending plastics to China also impeded the U.S. progression of advanced plastic-recovery technologies, such as gasification and pyrolysis. Products created by these technologies can have a market value that exceeds the cost of collection and processing. This was not always the case when selling plastics to China, as this market could be highly volatile. Even with unpredictable revenues, recycling companies perceived China as an eternal end market for their plastics. With China basically locking up the plastic supply chain, advanced plastic recovery technologies in the U.S. could not secure sufficient quantities of feedstock and, consequently, could not demonstrate financial viability for commercial-scale facilities.
Not only did China enthusiastically accept our recyclables, but they also turned a blind eye to the large quantity of trash (contamination) mixed in with the recyclables. This lenient policy validated the U.S. preoccupation with collecting as many recyclables as possible without really considering their quality, potential to become a valuable commodity or the carbon footprint created by using fossil fuels to transport them halfway around the world. Some in the environmental community began to question the net ecological impact associated with transporting recyclables to developing countries for remanufacturing, especially with the limited environmental regulations in these countries related to processing them into a new product. However, state recycling goals are typically based on the quantity of materials collected (rather than if they actually become a marketable product), and local recycling programs were only turning a small profit, or barely breaking even. Thus, no one wanted to “rock the boat.”
However, in 2018, China introduced the “National Sword” that almost sunk the U.S. recycling boat for the short term. The National Sword banned many scrap materials from entering China and required other materials to meet an extremely strict (low) contamination level of only 0.5%. To put in perspective, contamination rates of U.S. recyclables before processing (directly after they are collected) can reach 25% or higher. Processing removes some of the contaminants, but not typically down to 0.5%. After the National Sword, U.S. recycling companies started looking for new markets in other Southeast Asia countries. However, one by one, Vietnam, Thailand, Malaysia, and India also shut their doors by introducing new restrictions on waste imports. So far, there are few signs that any of these countries intend to relax their standards on contamination levels again.
In the short term, there is no question that the National Sword severely disrupted recycling in the U.S. The Chinese market for recyclable commodities was greater than the next 15 markets combined, leaving the U.S. with little in the way of backup to accept this commodity. Thousands of tons of recyclables are now in a landfill rather than becoming a new product. Some municipalities have stopped collecting recyclables (or specific items) altogether, and many more, both public and private, have been stockpiling collected materials in the hope that markets return.
In the long term, the National Sword may be the most significant catalyst to transform recycling since the Garbage Barge started its journey over 30 years ago. In 2019, seventeen North American paper mills announced an increase in their capacity to process recycled paper. Also, and somewhat ironically, Chinese paper companies have begun investing in North American mills because they could not import enough fiber feedstock. Experts anticipate the domestic market for fibers mills to improve for at least another three years.
Chemical companies have also begun investing in advanced plastic recycling technologies, improving recycling systems, and creating bio-based polymers since 2018. In April 2019, Brightmark Energy announced the closing of a $260 million financing package to construct the nation’s first commercial-scale plastics-to-fuel plant, which will be located in Ashley, Indiana. The plant is in a testing phase, and Brightmark anticipates bringing the facility to production-scale in 2021. Now, rather than using fossil fuels to ship plastics to China, more than 100,000 tons of plastics from Indiana and the surrounding region will become feedstock to produce fuel and other intermediate products.
While the U.S. recycling industry was busy making a comeback from the National Sword industry-wide disruption, in came another setback in the form of the 2020 global COVID-19 pandemic. Shelter-in-place orders began in March 2020 in many states, which resulted in families spending more time in their homes than ever before. As of August 2020, many businesses, schools, and governmental entities are still allowing or requiring their stakeholders to work or learn remotely from home.
This work or learn from home phenomenon has resulted in massive increases in MSW and recyclables placed at the curb for collection. From March to April 2020 alone, U.S. cities saw a 20% average increase in MSW and recycling collection tonnage. Struggling restaurants have to offer takeout and delivery services, which is further contributing to a rise in paper and plastic packaging waste. COVID-19 restrictions such as mask mandates have resulted in higher amounts of personal protective equipment in the waste stream, and many items that previously could have been recycled are now discarded due to sanitary concerns.
The higher volumes of MSW and recyclables encountered at the curb during a pandemic present both challenges and opportunities. Challenges include budget cuts due to lower tax revenues, adequately staffing and ensuring the safety of waste-handling employees, and preventing the spread of COVID-19 through the waste stream. During this unprecedented time where municipalities face complex decisions on how to manage their MSW, the opportunity for innovation within the solid waste industry could not be greater.
Cities have begun to “right-size” their recycling systems by evaluating the usage of community recycling containers and reducing/redistributing containers to maximize the quantity of recyclables each site receives. Communities are evaluating curbside recycling programs to increase efficiency, and decreasing contamination is a priority. “When in doubt, throw it out,” has replaced campaigns such as “Recycle more, it’s simple.”
Cities are embracing the concept of public-private partnerships with their recycling processors as they recognize the vital and interrelated role of both the public and private sectors in recovering recyclables. Lastly, the U.S. is beginning to drive manufacturing and end-use markets domestically to stimulate demand for recyclable materials – materials for which we have become so effective at collecting.
There is little doubt that through leadership, innovation, and strategic planning, cities will continue to help lead the way on recycling to achieve landfill diversion and provide for a more environmentally and financially sustainable solid waste management system for the next 30 years.
As reported in the July 29, 2020, digital news by Environmental Business International
Electronic waste represents billions in lost value
A record 53.6 million metric tonnes (Mt) of electronic waste was generated worldwide in 2019, up 21% in five years, according to the UN’s Global E-waste Monitor 2020. Only 17.4% of 2019’s e-waste was collected and recycled, meaning gold, silver, copper, platinum and other recoverable materials conservatively valued at $57 billion were mostly dumped or burned rather than being collected for treatment and reuse. The report predicts global e-waste will reach 74 Mt by 2030, making e-waste the world’s fastest-growing domestic waste stream. Global E-waste Statistics Partnership is a collaboration between UN University, International Telecommunication Union, International Solid Waste Assn. and the UN Environment Programme.
What can consumers do to help protect human health and the environment?
We can’t simply toss phones and electronics into our trash or recycling bins at home. To protect our health, water resources, and our communities we can reuse many of our devices and electronics. Try these; the links help you find local resources.
Discarded products with a battery or plug such as computers and mobile phones are electronic waste or (e-waste). Toxic and hazardous substances such as mercury, brominated flame retardants (BFR), or chlorofluorocarbons (CFCs) are found in many types of electronic equipment and pose a severe risk to human health and the environment if not handled in an environmentally sound manner.
While most electronics are not designed or assembled with recycling in mind, separate collection and recycling of e-waste can be economically viable for products containing high concentrations and contents of precious metals. Cell phones and computers contain base materials such as gold.
Recycling programs are often confronted with the costs of recycling vs material recovery markets, and because the recovery of some materials is especially challenging. Within the paradigm of a circular economy, the mining of e-waste can be considered an important source of secondary raw materials.
Thanks for helping us keep our communities safer!
For community recycling and reuse program development visit our Sustainable Materials Management website.
Utility Dive reports that Alliant Energy announced its commitment to net-zero carbon emissions from its electricity by 2050.
The “new aspirational goal” reduces carbon emissions by 50% below 2005 levels by 2030 and eliminates all coal-fired power by 2040, 10 years faster than previously planned. Alliant owns or partially owns eight coal-fired power plants across Wisconsin and Iowa — three of which are slated for retirement or conversion to natural gas.
Alliant’s announcement follows growing commitments by investor-owned utilities to move toward a more low-carbon fuel mix. Xcel Energy, Madison Gas, and Electric and Consumers Energy are among the other Midwest utilities to have made such a pledge.
Alliant reached its 30% renewables by 2030 goal this year and its “intention is [to] keep adding renewables to our energy mix,” utility spokesperson Scott Reigstad said in an email.
Alliant also said it may keep some natural gas-fired plants online, retrofitted with carbon capture or some other emissions-reducing technology, or it could also use carbon offsets to reach that goal.
Read the full article including solar and other renewables on Utility Dive’s website.
Article published in the January 2020 edition of Waste Advantage Magazine.
At the Federal level, GHG emission reporting has become part of the standard regulatory requirements; however, on the west coast, GHG programs continue to develop and evolve from reporting to reduction programs beyond federal requirements. Solid waste facilities can be impacted by all of these reporting mechanisms directly as a landfill located in the state in question, opting in for C&T as part of the LCFS in California, or in limbo, as the courts work out the legality of Washington’s Clean Air Act. More stringent federal GHG requirements are unlikely with the current administration, however, that could change with the 2020 election. In general, GHG rules and legislation keep developing and updating to account for and reduce GHG emissions.
Read, share, or download the full article here.
 Cassandra Drotman Farrant is Project Manager with SCS Engineers. She has nine years of experience in environmental consulting, specializing in environmental assessment and greenhouse gas (GHG) verification. Cassandra has participated in many GHG verification projects throughout the U.S. and has completed approximately 70 Phase I Environmental Assessments (ESAs) in California, Oregon, and Washington. Phase I projects included research and review of geologic and hydrogeologic conditions at project sites and in the surrounding areas and evaluating the potential for soil and groundwater contamination from on and offsite sources. Cassandra has completed emissions estimates and inventories and has prepared numerous permit-to-construct/operate permit applications. She prepares compliance reports, which includes reviewing and maintaining records and regulatory deadlines.
SCS Engineers provides engineering, consulting, operations and monitoring services to report and reduce greenhouse gas emissions. Select a service category to learn more.
The International Solid Waste Association (ISWA) has determined that uncontrolled dumpsites hold 40% of the world’s waste and that the world’s 50 biggest dumpsites (identified through a voluntarily survey conducted by D-Waste in 2014) directly affect the daily lives of 64 million people, equivalent to the population of France.
The ISWA reports (2014, 2015a, 2015b, 2016) showcase how eliminating dumpsites is an urgent issue, affecting local, regional, and even global health and the environment. Important findings indicate that 38 out of the 50 biggest dumpsites directly impact marine and coastal areas and can become sources of disease outbreaks and the release of wastes (particularly durable plastics) to waterways and the oceans.
Studies suggest that non-engineered dumps and uncontrolled landfills are the third largest source of global anthropogenic methane, a greenhouse gas about 25 times more potent than carbon dioxide (CO2), accelerating climate change. It is estimated that open dumps emit the equivalent of more than 20 million metric tonnes [tons] of CO2 per year. Without any action, it is projected that existing open dumps will account for 10% of global greenhouse gas emissions by 2025.
If open dumps instead were replaced by engineered landfills with state-of-the-art landfill gas collection and destruction systems, it would be like removing five million cars from the planet.
In 2018, ISWA’s Working Group on Landfill (WGL) developed a Task Force on Closing Dumpsites (TFCD) and presented its dump closure initiative as one of its flagship projects for the future at the United Nations (UN) Conference on Housing and Sustainable Urban Development – Habitat III.
Please read this important ISWA Editorial by James Law and David Ross on this significant issue. The editorial contains a link to the full article available on open access through ISWA’s Journal, Waste Management & Research here.
SCS Engineers brochure – Closing Dumpsites is also available.
This article discusses global air quality and how the collaboration between policy-makers and the scientific community can have a continued positive impact on air quality in the U.S. This collaboration has been the primary cause for the improvements observed in air quality over the past few decades.
U.S. Environmental Protection Agency (EPA) programs, such as the New Source Performance Standards (NSPS), New Source Review, and Maximum Achievable Control Technology standards, have all had a significant impact on improving air quality by lowering the ambient concentrations of NOX, VOC, CO, SOX, and PM.
Some areas, such as southern California, have committed to working toward electrifying the transportation network, implementing more stringent standards on diesel fuel sulfur content, and encouraging heavier utilization of public transportation.
Author: SCS Engineers’ Ryan Christman, M.S., is an air quality engineer and environmental management information systems specialist with experience in the oil and gas industry and the solid waste industry. He is just one of SCS’s outstanding Young Professionals.
“This program directly supports the county’s Roadmap to a Sustainable Waste Management Future by helping businesses to implement recycling programs,” says Leonard. “And not only recycling but waste reduction, as well, all of which, of course, contribute to reducing greenhouse gas emissions, resource management and sustainable materials management.”
Read the article about L.A. County’s Plan for Sustainable Waste Management
…and as waste settles, it can have an effect on equipment,” according to Pat Sullivan of SCS Engineers in this ClimateWire article. As the U.S. EPA focuses on pushing landfill owners into cutting down on methane emissions some worry that a combination of tightening regulations and poor cost analysis might put some smaller landfills out of business.
LANDFILL EMISSIONS: Going to the dump? You might make electricity
Kavya Balaraman, E&E reporter
Reprinted from ClimateWire with permission from E&E Publishing, LLC. Copyright 2016.
Corporate Headquarters